
Figure 2. Numbers and sizes of expanded clones derived from salivary gland.
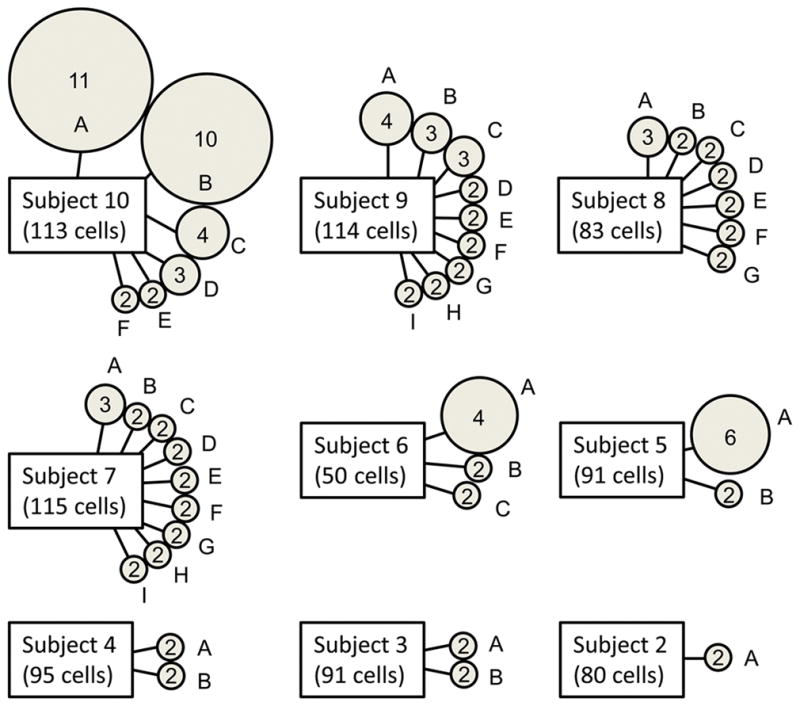
Each circle represents an expanded T cell clone. Numbers inside of circles indicate the number of cells expressing nucleotide-identical complementarity-determining region 3 (CDR3) sequences. Letters designate particular expanded clones and match designations in Table 3. The total number of single cells evaluated is shown below each subject label.