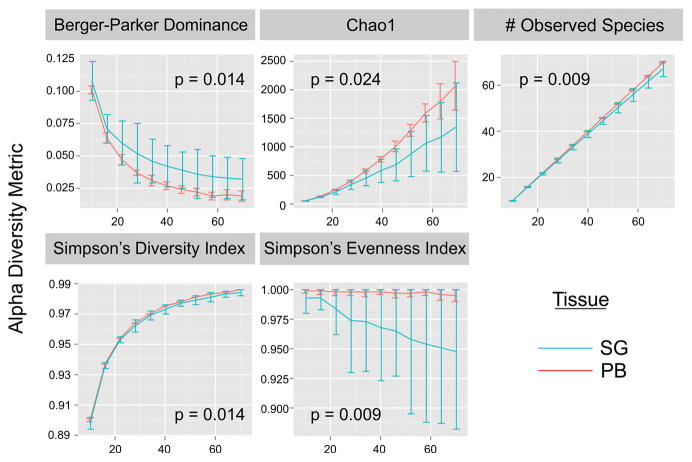
Figure 3. Biodiversity metrics plotted as a function of sequence depth.
Separate salivary gland (SG) and peripheral blood (PB) data sets, each containing the complete TCRα and TCRβ CDR3 sequences, were evaluated using alpha biodiversity statistics. Under all metrics, there was a significant difference in diversity between the PB and SG samples at increasing depth. P values are from nonparametric, 2-tailed, 2-sample t tests. Error bars are SD.

