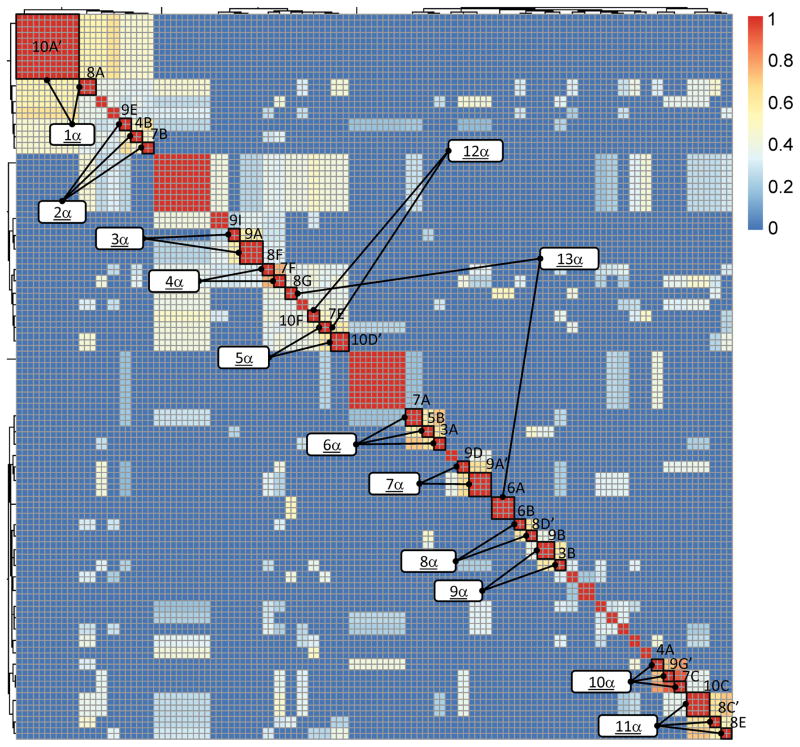
Figure 5. Heatmap BLAST similarity matrix of expanded salivary gland T cell receptor α complementarity-determining region 3 amino acid sequences from 10 subjects with primary Sjögren’s syndrome.
Red indicates identity. Blue indicates minimum similarity. The numbers on the color scale indicate the fraction of the maximal blast score, with 1 indicating identity and 0 indicating no similarity. Clusters selected for multiple sequence alignments are indicated by the lines connecting each to its designation, as is noted in the white boxes. Expanded clone designations are as indicated in Table 3 and Figure 2.

