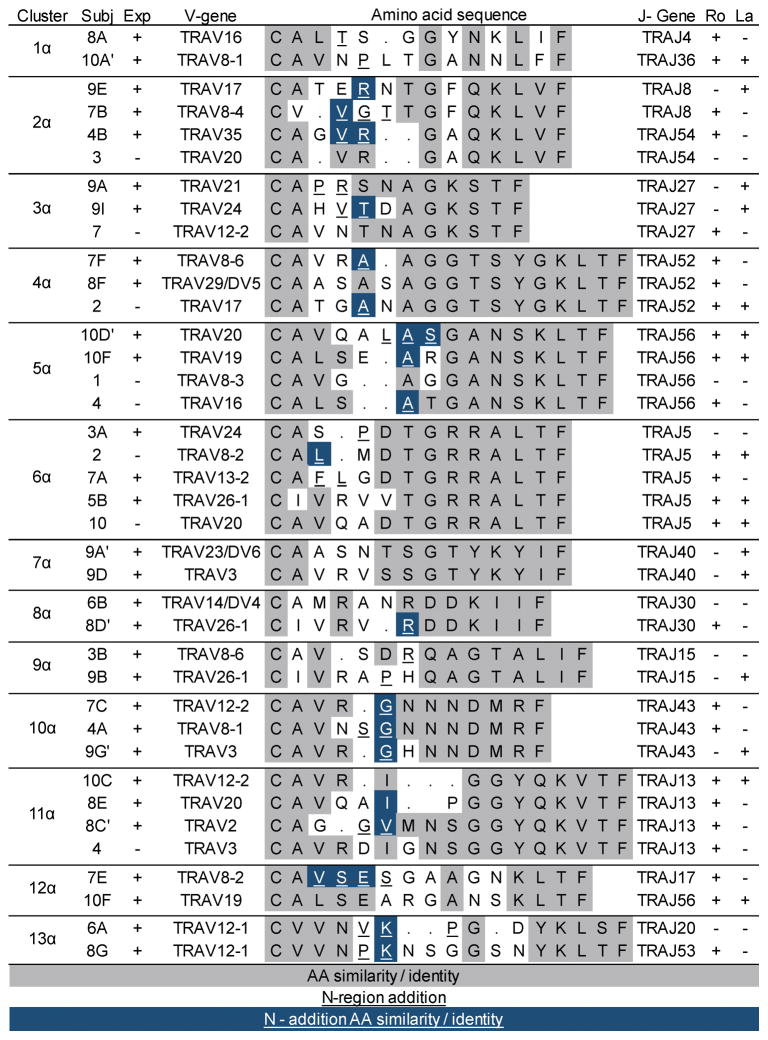
Figure 7. Alignment of T cell receptor α sequences from expanded salivary gland clones and closely related unique cells.
Cluster designations match those indicated in Figure 5. Subject (Subj) designations indicate particular expanded clones and match designations in Table 3 and Figure 3. For cells with two α chains, the second one is designated with a prime symbol. Sequences that are part of clonal expansions (Exp) are indicated by “+,” and unique sequences are indicated as “−.” Shading and underlining are as described in the legend for Figure 6. Ro and La antibody status of each subject is listed as positive (+) or negative (−).

