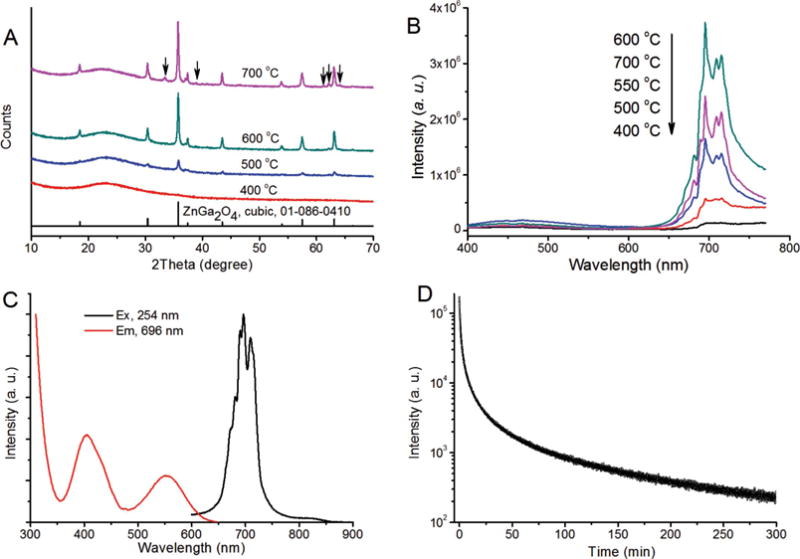
Figure 1.

Optimization of the experimental conditions. A) XRD and B) photoluminescence spectra (excitation wavelength, 254 nm) of the mZGC samples synthesized at various temperatures, C) PL excitation and emission spectra (tested by using the phosphorescence mode of the fluorimeter), D) PL decay curve of mZGC synthesized at 600 °C, excited by UV lamp (254 nm). Sample mass for above measurements are 100 mg.
