
Figure 3.
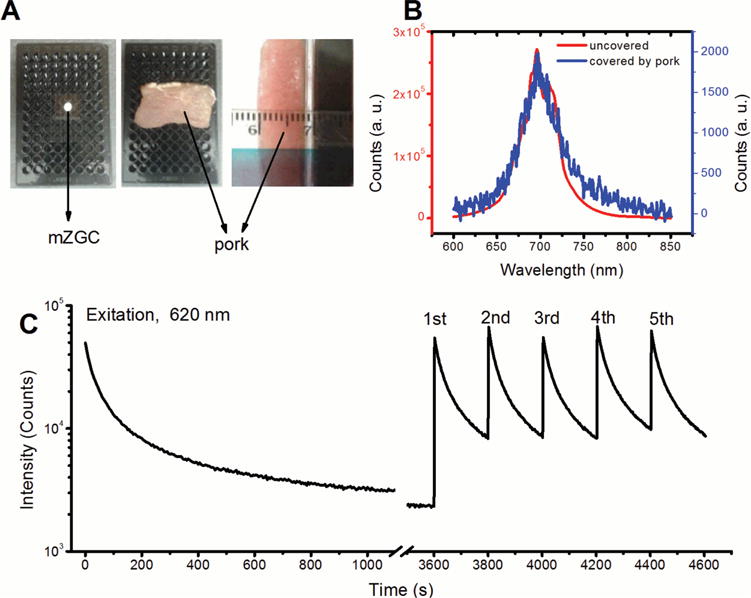
In situ simulated deep-tissue charging properties of mZGC. A) Optical image of in situ excitation, B) PL spectra covered and uncovered by pork layer, C) in vitro charged and recharged decay curves of mZGC. All spectra were recorded with the ZGC under an 8 mm pork layer.