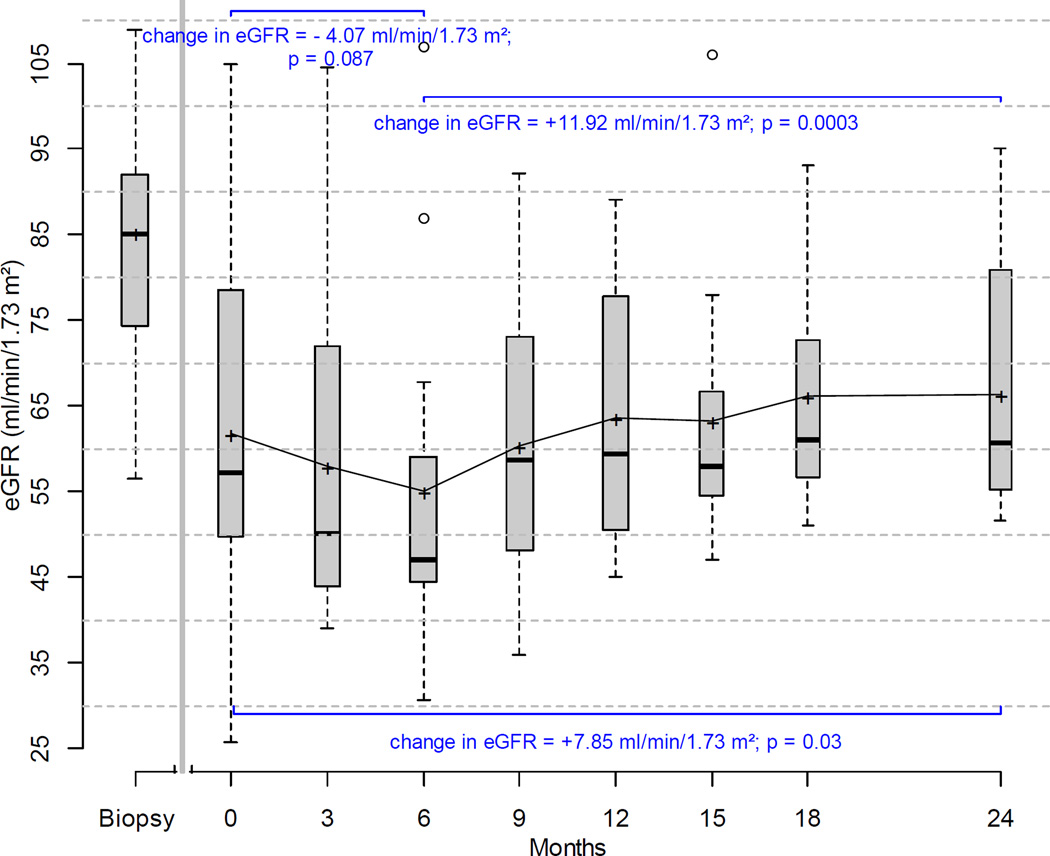
Figure 2. Box plots showing changes in eGFR (CKD-EPI) from the time of diagnosis (Biopsy) to study initiation/enrollment (Time 0) to 24 months.
Estimates of changes in eGFR over various intervals are based on mixed-effects models. During the observation phase (defined as time from biopsy to start of study drugs at Time 0), there was a decline in renal function; the slope of decline in eGFR was −1.89ml/min/1.73m2 per month. Initiation of induction therapy was associated with further decline in renal function that improved as cyclosporine was tapered and discontinued during the maintenance phase (starting at month 7). The change in eGFR during the induction phase was − 4.07 ml/min/1.73m2 and +11.92 ml/min/1.73m2 during the maintenance phase (7–24 mos). By 24 months, there was improvement in renal function compared to enrollment (Time 0) values.
The top and bottom of the box are the estimated 75th and 25th percentiles. The horizontal lines and “+” signs within each box represent the median and mean values respectively. The vertical dashes denote the largest as well as the smallest data point that is within 1.5 times the interquartile range (75th to 25 th percentile) above the 75th percentile or below the 25th; data points outside of this range are denoted by hollow circles. P values compare 0 vs. 6 mos, 6 mos vs. 24 months and 0 vs. 24 months.

