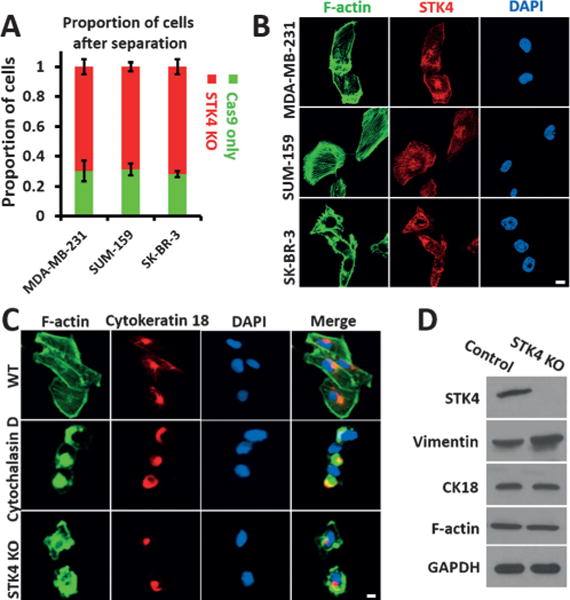
Figure 4.

Effect of STK4 on cell deformability and cytoskeletal distribution. A) Quantification of cell proportions at the outlet after separating an equal mixture of STK4 KO cells and cells expressing FLAG-Cas9 only. Error bars indicate SEM (n=3). B) Co-staining of F-actin and STK4 with Alexa Fluor 488 Phalloidin and anti-STK4 (red) antibodies (scale bar: 5 μm). C) Staining of F-actin and CK18 in WT, Cytochalasin D treated, and STK4 KO MDA-MB-231 cells (scale bar: 5 μm). D) Western blot analysis of Vimentin, CK18, and F-actin in STK4 KO MDA-MB-231 cells. GAPDH was used as the loading control.
