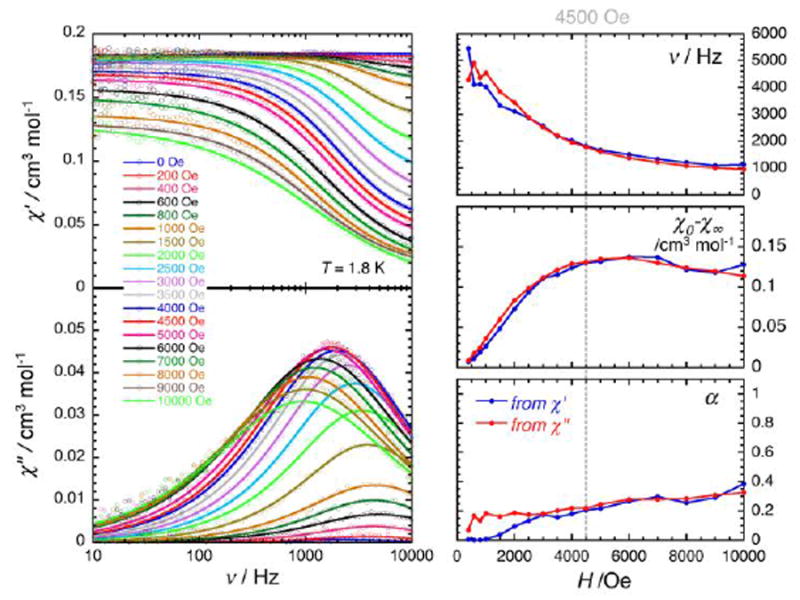
Figure 6.

Left part: Frequency dependence of the real (χ’, top) and imaginary (χ”, bottom) parts of the ac susceptibility at 1.8 K at different dc-field between 0 and 1 T for a polycrystalline sample of 2. Solid lines are the best fit of the experimental data to the generalized Debye model.30 Right part: Temperature dependence of the magnetic parameters deduced from the fits of the χ’ vs. ν (blue dots) and χ” vs. ν (red dots) data shown in the left part of the figure using the generalized Debye model30 (ν : characteristic ac frequency; χ0- χ∞ : amplitude of the relaxation mode with χ0 and χ∞ being the in-phase ac susceptibilities in the zero and infinite ac frequency limits, respectively; α : the distribution of the relaxation). The solid lines are guides for the eyes.
