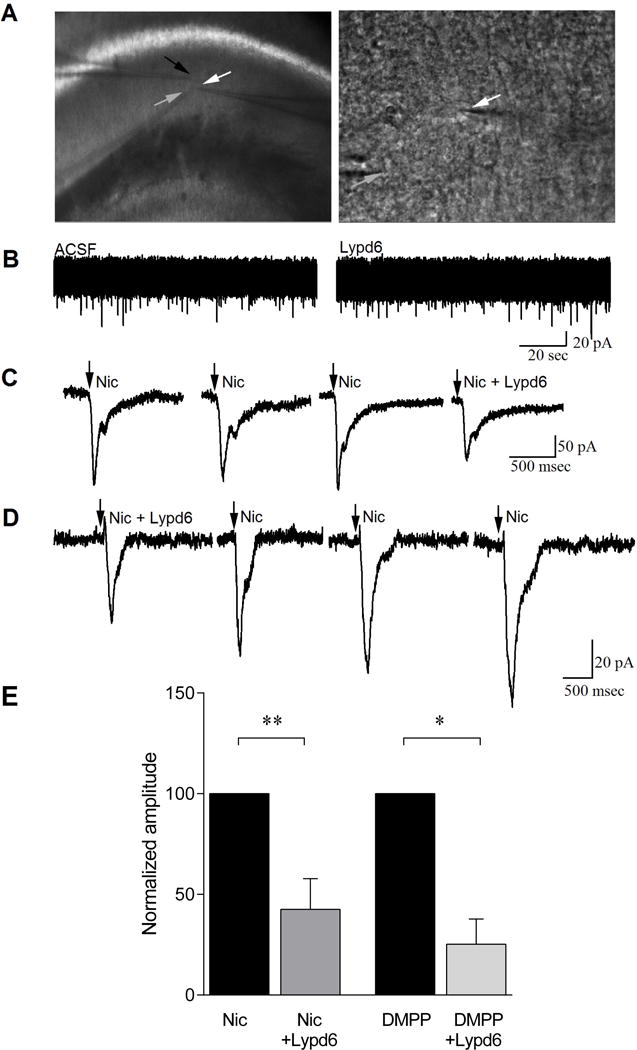
Figure 4. Lypd6 reversibly attenuates nAChR-induced membrane responses in CA1 hippocampal interneurons.

(A) Bright field image of the stratum radiatum of the CA1 hippocampal region where recordings were conducted (white arrow indicates recorded cell). Lypd6 (6 μM) was applied via a 2nd patch pipette (black arrow) close to the recorded cell and nicotine was applied via a 3rd pipette (grey arrow). Higher magnification image of a CA1 interneuron recorded for this study (white arrow). The electrode delivering nicotine is also visible (grey arrow). (B) Whole-cell, voltage clamp recordings from a CA1 interneuron showing no effect on induction of inward current by application of Lypd6. (C) An example of whole-cell, voltage clamp recordings from a CA1 interneuron showing induction of inward current by application of nicotine (arrow) and attenuation of this current when applied in the presence of Lypd6 (Nic + Lypd6). Nicotine responses were not attenuated with a 3 minute interval between applications, indicating that reductions induced in presence of Lypd6 were not due to cell run down, but were specific to presence of the protein. (D) An example of whole-cell voltage clamp recordings from a CA1 interneuron, pre-incubated in Lypd6 for 5 minutes before first application of nicotine, showing that the effect of Lypd6 is lost upon wash-out. The recording examples shown in (C) and (D) are not representing the mean values, but were rather chosen as high-amplitude samples to clearly demonstrate the inhibitory effect of Lypd6. (E) Graphs of mean responses to nicotine (ncells=5) and to the non-subtype specific nAChR agonist DMPP (ncells=3) from the population of cells recorded, indicating that when Lypd6 is present, the amplitude of inward currents induced by activation of nAChRs is significantly reduced. Data are displayed as the each cell’s response to the agonist in presence of Lypd6 normalized to the same cell’s response before the addition of Lypd6. Values are represented as mean ± SEM. * P < 0.05, ** P < 0.01, indicates statistical difference between groups in a paired t-test.
