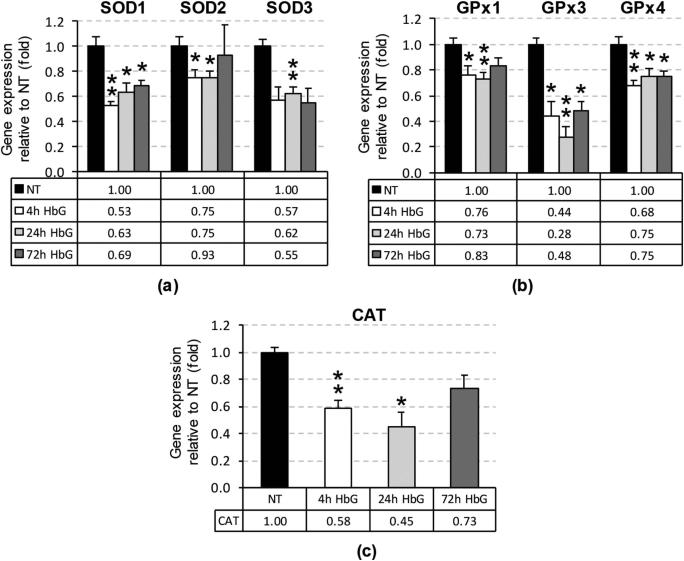
Figure 1.
Renal antioxidant gene mRNA levels following infusion with HbG. The relative mRNA levels of SOD1-3 (a); GPx1, GPx3, and GPx4 (b); and CAT (c) were assessed by qPCR as described in “Materials and methods” after 4, 24, and 72 h post-ET. The reference value reported as fold change normalized to GAPDH and relative to NT, equals 1. Values are means ± standard error (SE) from 3 to 5 animals per group. Asterisks indicate significant differences compared to NT (* p < 0.05, ** p < 0.01). NT: sham-operated no treatment group.

