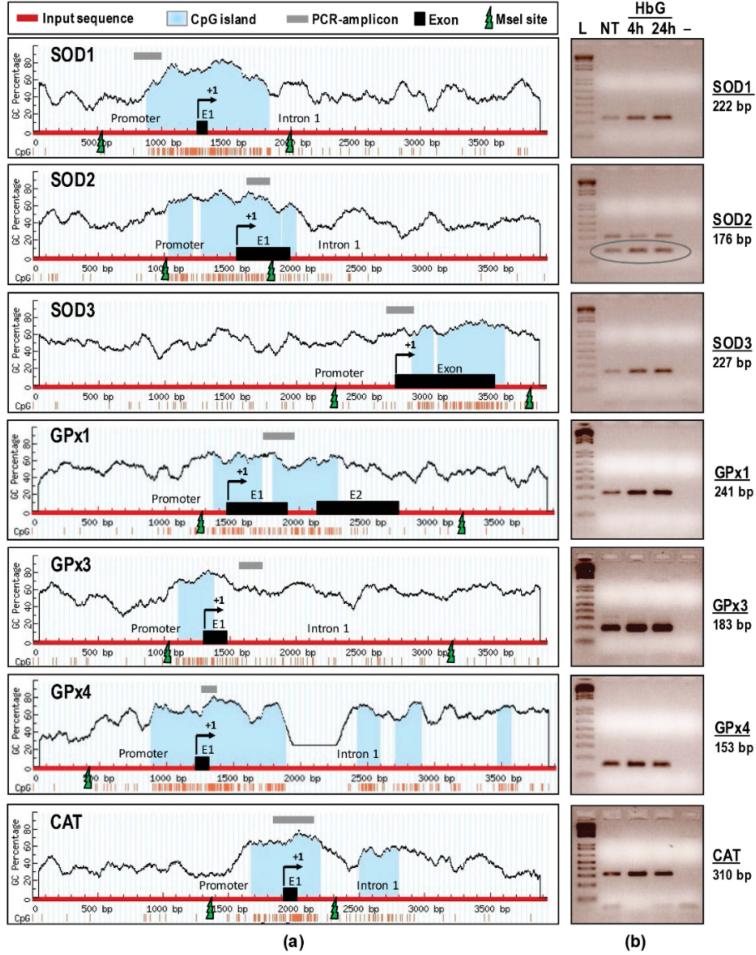
Figure 4.
DNA methylation status of SOD1-3, GPx1, GPx3, GPx4, and CAT following HbG infusion. (a) CpG island search and restriction mapping. Four kb genomic regions (thick red line) harboring putative promoter, exon 1, and intronic regions of SOD1-3, GPx1, GPx3, GPx4, and CAT were subjected to sequence analysis. Located CpG islands indicated in light blue, PCR amplicons in grey line, exons (E1-E2) in black boxes, MseI restriction sites in green lightning bolts, and TIS labelled as +1. Vertical lines depict GC percentage; (b) Agarose gel images (inverted) of hypermethylated SOD1-3, GPx1, GPx3, GPx4, and CAT following HbG infusion. The expected sizes (in bp) of PCR amplicons listed on the right. L: Ladder (1 Kb Plus), NT: non-treatment group, HbG (4 h or 24 h): oxyglobin-infused groups at different time points. “–“: Template-less negative control. The SOD2 resulted in two distinct amplicons (approximately 176 bp and 310 bp), however the lower band with predominant intensity is the expected one (circled).

