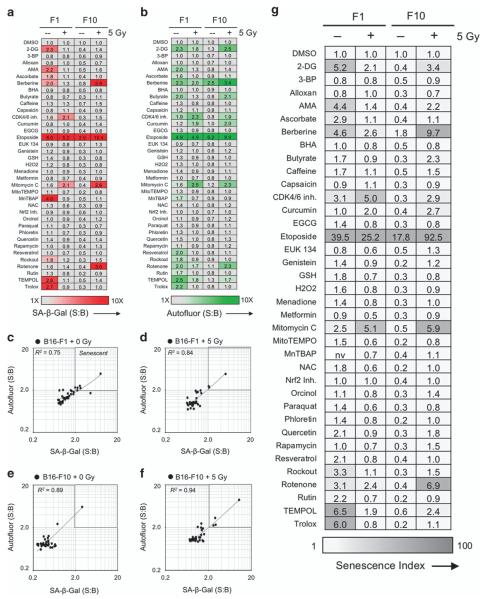
Figure 2.
Flow cytometric senescence screen of redox-modulating compounds ± low-dose IR. (a and b) Heat maps showing screening results for 36 known redox-modulating compounds added to B16 melanoma cell line variants F1 and F10. Cells were subjected to either 0 or 5 Gy γ-IR and screened in 96-well plates. (a) SA-β-Gal was measured at 660 nm using near-infrared probe DDAO-Gal and (b) cellular AF was measured at 525 nm using a stain-free approach. Signal versus background (S:B) data as shown were calculated as average MFI of duplicate experimental samples divided by untreated control. (c–f) Statistical analysis of correlation (R2) between SA-β-Gal and cellular AF for identification of senescence-inducing conditions. Data points were taken from screening analysis shown in (a and b). Etoposide is the outlier in each data plot. Results indicate that across cell lines and conditions, SA-β-Gal and AF were generally correlated. Conditions that exhibited ≥ 2.0-fold elevation for both SA-β-Gal and AF were considered screening hits. Values for SA-β-Gal and AF are multiplied to determine the SI as a single metric measuring senescence induction for each condition. (g) Heat map showing SI values for screening conditions. The single metric allows at-a-glance interpretation of senescence screening data obtained rapidly using living cells.

