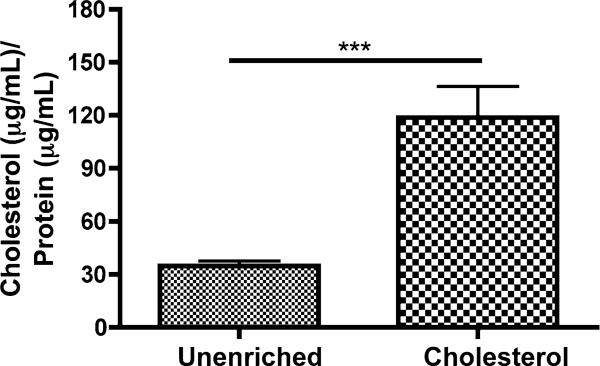
FIGURE 1.
Quantification of cholesterol enrichment using cholesterol-cyclodextrin complexes. Cells were incubated with either PBS with calcium/magnesium or 3.5 mM cholesterol for 30 min at 37 °C. Cells were lysed, and protein and cholesterol content were assayed. Cholesterol enriched cells showed a 3.5× increase in cholesterol as compared to unenriched cells. (Means and SEM were plotted, two-tailed t test ***p<0.0001 n = 6 unenriched, n = 6 cholesterol).

