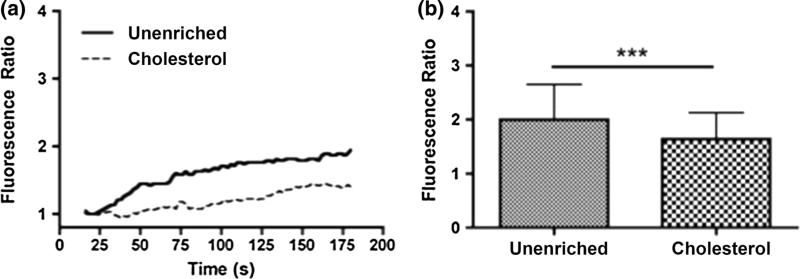
FIGURE 6.
Cholesterol attenuates the LPC stimulated calcium response. Cells were stimulation with 300 nM of LPC. Prior to stimulation, cells were treated with either PBS with Ca+2 (solid line) or 3.5 mM cholesterol (dotted line) at 37 °C for 30 min. (a) Representative traces to LPC stimulation in unenriched and cholesterol treated cells. LPC stimulates a gradual increase in calcium that was attenuated by cholesterol enrichment. (b) Bar graph showing that cholesterol statistically attenuates the peak calcium response in 180 s to LPC. Average responses represent multiple coverslips (cs) and total cell count among coverslips (n) Unenriched: #cs = 9, n = 359, Cholesterol: #cs = 8, n = 320, Mean and SEM were plotted two-tailed t test ***p<0.0001.

