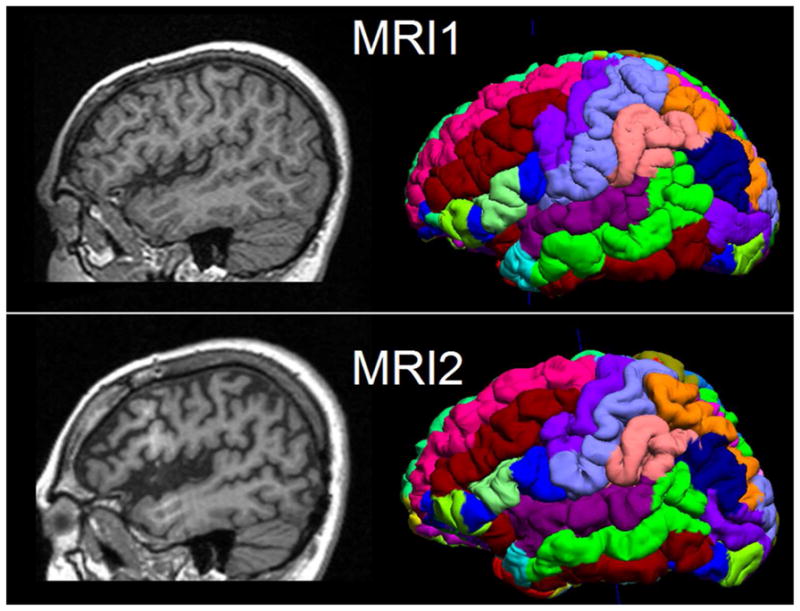
Figure 1.

Illustration of two serial MRIs from the same patient (P6) and the surface and volume registration (SVReg) output of BrainSuite. First row: MRI at age 10. Second row: MRI at age 17. Shown in the left column are the sagittal T1-weighted MPRAGE images. The right column is the cortical rendering of the SVReg labels, with different colors denoting different anatomical areas of the brain. Pronounced atrophy can be observed at the perisylvian area, and the interhemispheric ratio (HRvol) showed decrease from 0.79 to 0.70.
