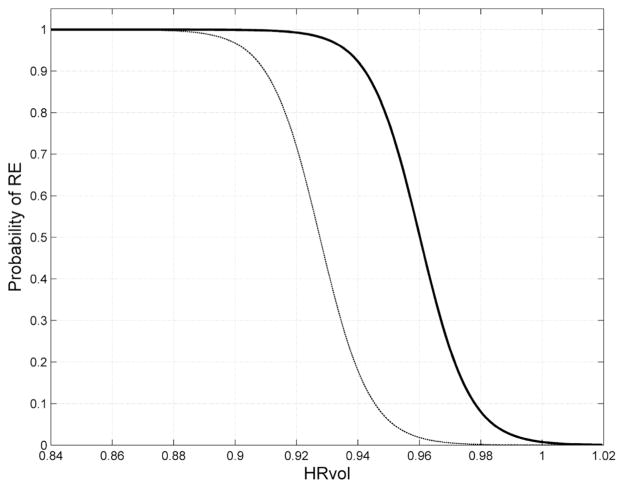
Figure 6.
Probability curves depicting the relationship between HRvol and the probability of RE. The solid curve was estimated based on comparison of 42 RE patient scans and 42 non-RE epilepsy control scans with the same disease duration. The dashed curve was additionally generated to correct for the difference in incidence for RE and non-RE epilepsy (1 in 1,000,000 vs. 1 in 100).

