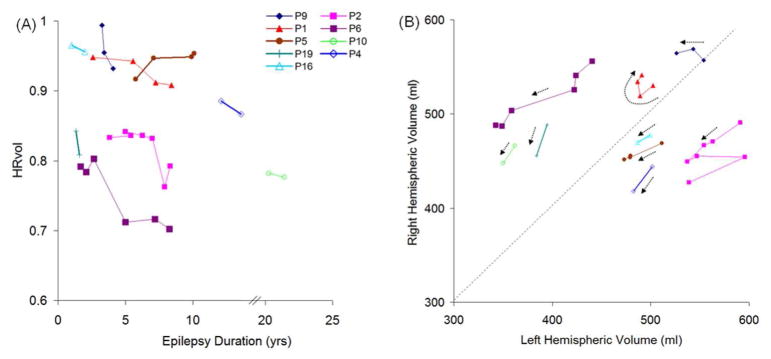
Figure 7.
(A) HRvol plotted over epilepsy duration in the 9 patients with serial MRI. All but P5 showed a decrease in HRvol over the observed period of time. The axis was broken from 14 to 20 years since there are no data points for these durations. (B) Absolute hemispheric volume (right side plotted vs. left side) of the same 9 patients. Dotted arrows for the data of each patient show progression of time; beginning of arrow denotes earlier scans. Panel A and panel B share the same symbol for each patient for direct comparison.

