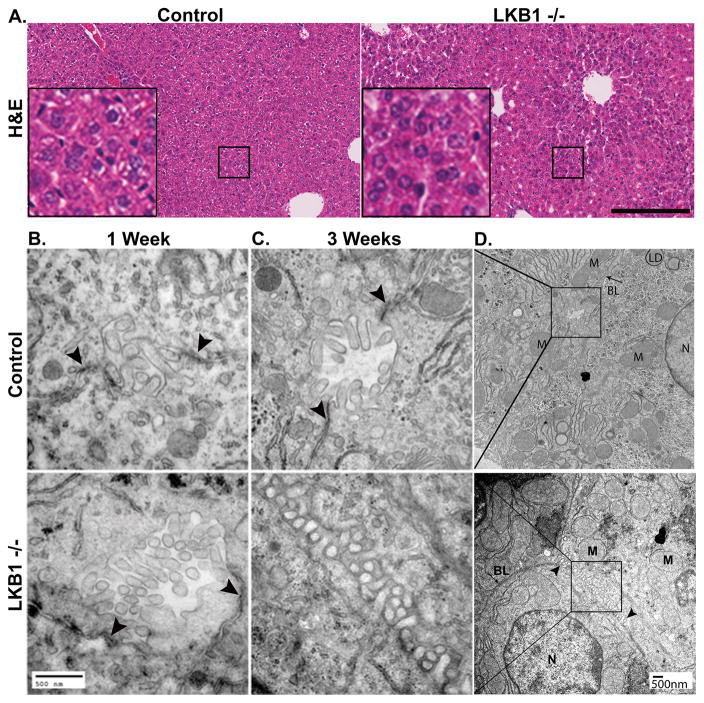
Figure 1. Hepatocytes and tissue architecture in control and LKB1 −/− mice.
A. Livers from 3-week old control and LKB1 −/− mice were stained with H&E. Scale bar: 200μm. B. TEM of liver sections from 1-week control and LKB1 −/− mice (upper and lower panel, respectively). Arrowheads indicate TJs. C. TEM of liver sections from 3-week control and LKB1 −/− mice (upper and lower panel, respectively). Arrowheads indicate TJs in control (upper panel). In LKB1 −/− (lower panel) bile canaliculi morphology was altered. D. Lower magnification of the insets shown in C. N=Nucleus; M=Mitochondria; BL=Basolateral; LD=Lipid droplet. Scale bar: 500nm.

