. Author manuscript; available in PMC: 2016 Aug 1.
Published in final edited form as: Mol Oncol. 2015 Sep 15;10(1):138–147. doi: 10.1016/j.molonc.2015.09.002

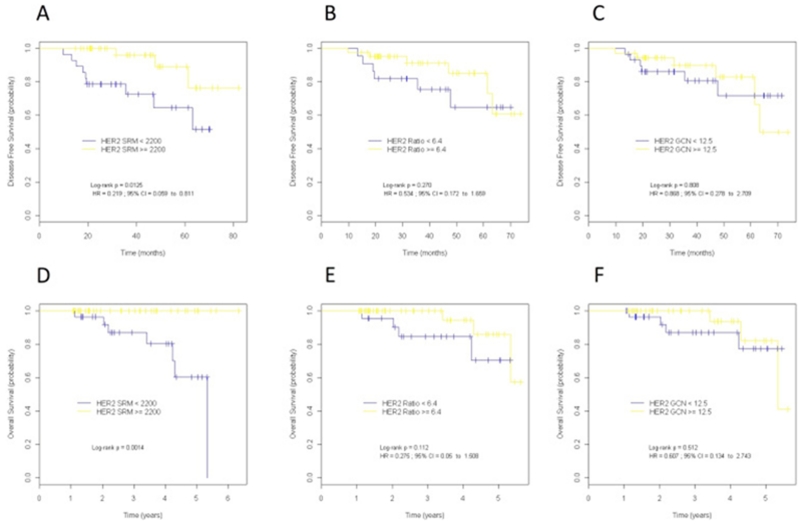
Figure 4. Kaplan–Meier curves for disease-free survival (A–C) and overall survival (D–F) according to HER2 protein expression by SRM-MS (A,D), HER2/CEP17 ratio (B,E) and HER2 gene copy number (GCN) (C,F) in patients treated with anti-HER2 in the adjuvant setting. Optimal cutoff values were determined by receiver operating characteristic (ROC) analysis. Disease-free survival and overall survival were superior for the group of patients with high HER protein levels (>2200). HR, hazard ratio; HER2 Ratio, HER2/CEP17 ratio; CI, confidence interval.

Figure 4