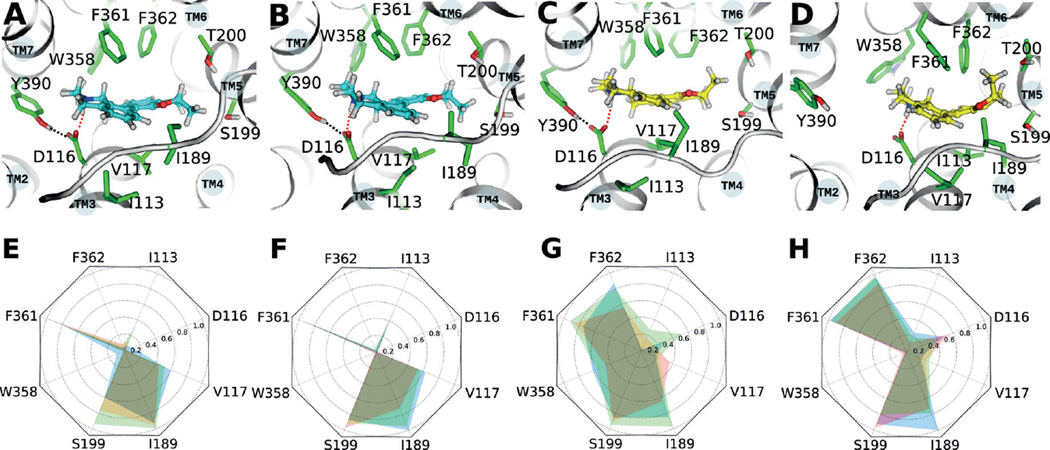
Figure 1.
Interactions of ligands with side chains in the binding pocket of the 5-HT1A receptor. A) Antagonist; beginning of MD simulation. B) Antagonist; last frame of MD simulation. C) Agonist; beginning of MD simulation. D) Agonist; last frame of the MD simulation. Cyan: antagonist epimer, yellow: agonist epimer, green: highlighted side chains in the binding pocket of the 5-HT1A receptor. Blue dashed lines: ionic interactions between D1163.38 and the ligand, red dashed lines: hydrogen bond between D1163.38 and Y3907.43. E) Interaction fingerprint between the 5-HT1A receptor and the antagonist in the initial 50 ns. F) Interaction fingerprint between the 5-HT1A receptor and antagonist in the final 50 ns. G) Interaction fingerprint between the 5-HT1A receptor and agonist in the initial 50 ns. H) Interaction fingerprint between the 5-HT1A receptor and agonist in the final 50 ns. Blue, green, and red areas represent the three different MD simulations presented in this work.

