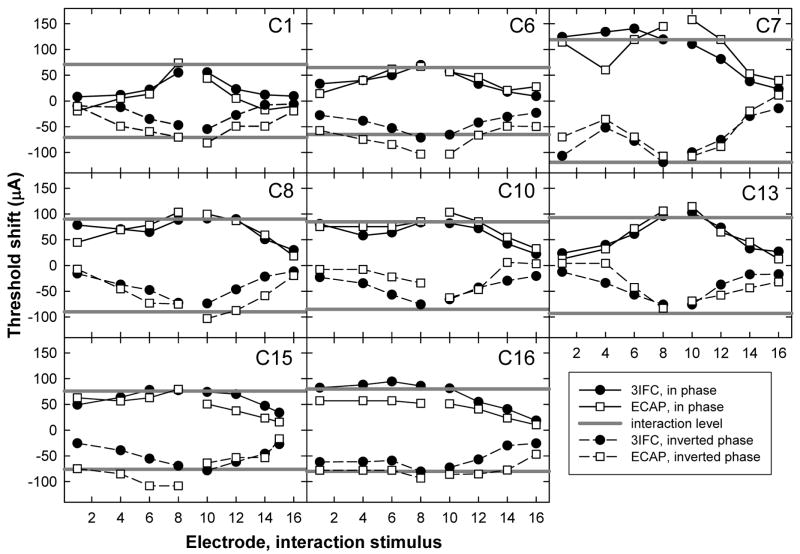
FIG. 8.
Individual interaction patterns for P9; each panel represents data from a different subject. ECAP (open squares) and psychophysical (3IFC; filled circles) threshold shifts are plotted as a function of interaction electrode location. Symbols connected with solid lines represent threshold shifts with the addition of an in-phase interaction stimulus and dashed lines represent the inverted-phase condition. Solid gray lines represent the interaction stimulus level, with negative values representing the inverted phase condition.

