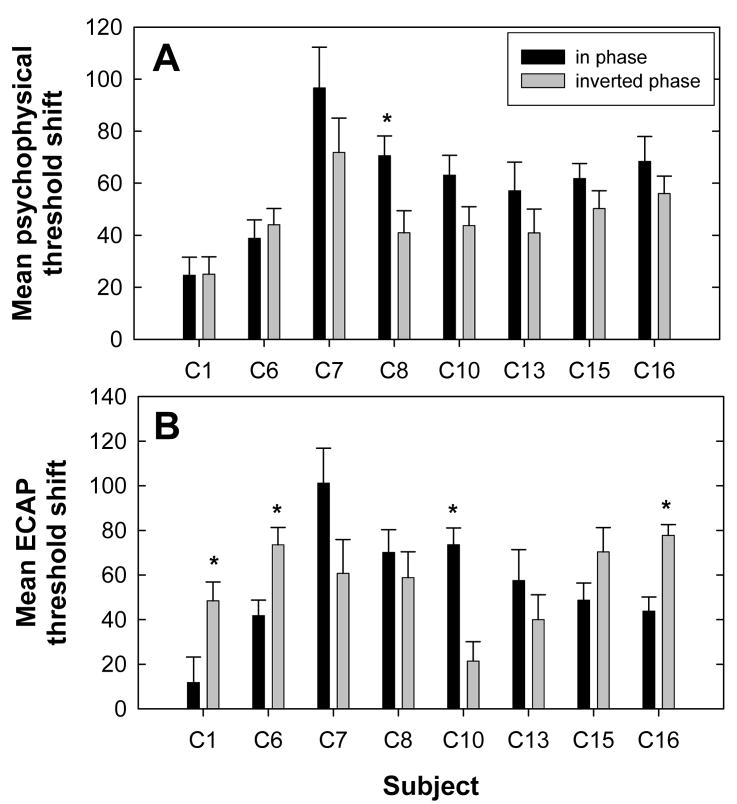
FIG. 9.
Mean threshold shifts (+1 SEM) across P9 interaction electrodes for in-phase (black bars) and inverted-phase (gray bars) conditions for each subject. Data were calculated from Fig. 8. A: psychophysical threshold shifts, B: ECAP threshold shifts. Asterisks indicate a statistically significant difference between phase conditions (p < 0.05).

