
Figure 5.
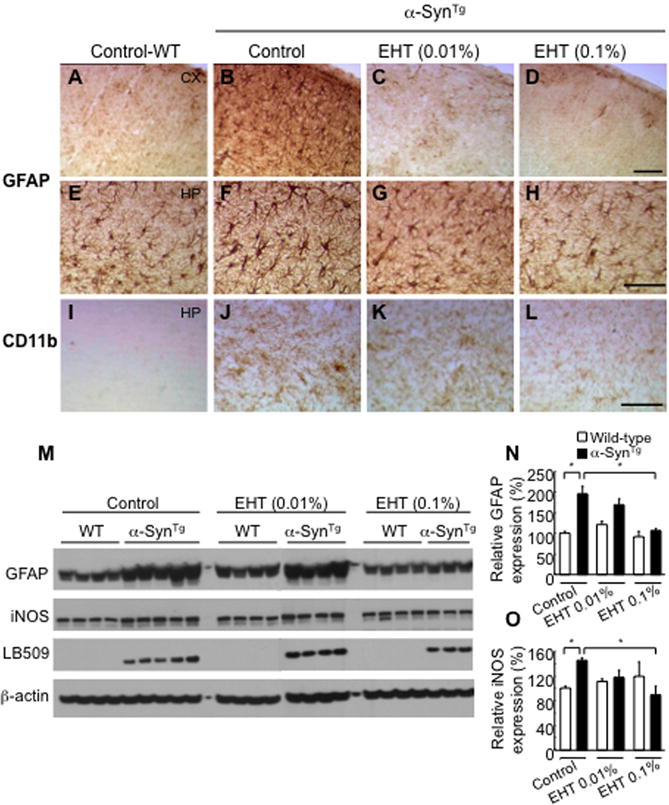
Repression of glial activation by EHT administration. A–H, Immunohistochemistry for GFAP in cortex (top row) and hippocampus (second row) demonstrating significantly more intense staining in α-SynTg mice compared to wild-type littermates and reduction with EHT treatment. Scale bar = 100 μm. I–L, Staining with the microglial marker CD11b showing the same trend. M, Western blotting of cortical tissue lysates (soluble fraction) with GFAP, iNOS and LB509 (human monoclonal α-Syn antibody). N, Quantification of GFAP band intensities relative to β-actin shown in panel M. O, Quantification of iNOS band intensities shown in panel M. * p < 0.05.