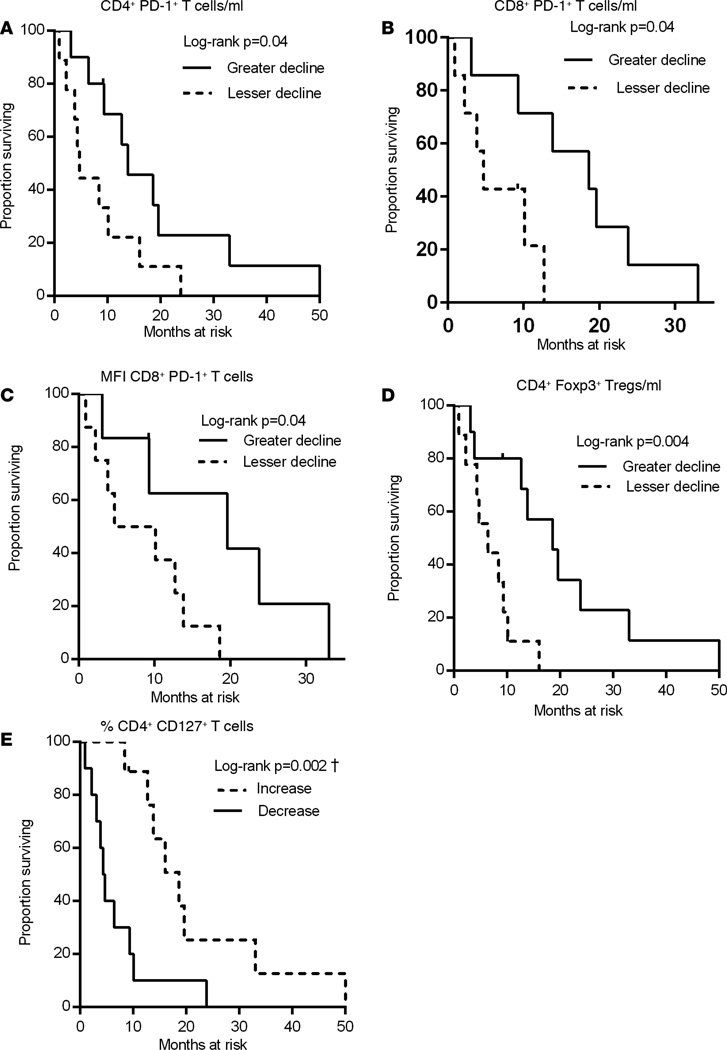
Figure 4. Kaplan-Meier plots illustrating the impact of the sorafenib-induced decrease in PD-1+ T cells or Tregs on OS.
The association between OS and the change in the immune parameters of HCC patients was calculated as described in Methods. (A) Absolute numbers of CD4+PD-1+ T cells. Median Pre = 28.05, Post = 18.08, median of ln (1 + Post) − ln ( 1 + Pre) = −0.24. (B) CD8+PD-1+ T cells. Median Pre = 18.27, Post = 10.84, median of ln (1 + Post) − ln (1 + Pre) = −0.46. (C) Expression levels of PD-1 (MFI) on CD8+ T cells. Median Pre = 285, Post = 248, median of ln (1 + Post) – ln (1 + Pre) = −0.32. (D) Absolute numbers of CD4+Foxp3+ T cells. Median Pre = 13.84, Post = 10.01, median of ln (1 + Post) − ln (1 + Pre) = −0.32. (E) Frequency of CD4+CD127+ T cells. Median Pre = 73.60, Post = 74.40, median of ln (1 + Post) − ln (1 + Pre) = 0.01. †P < 0.003 statistically significant after Hommel multiplicity adjustment.

