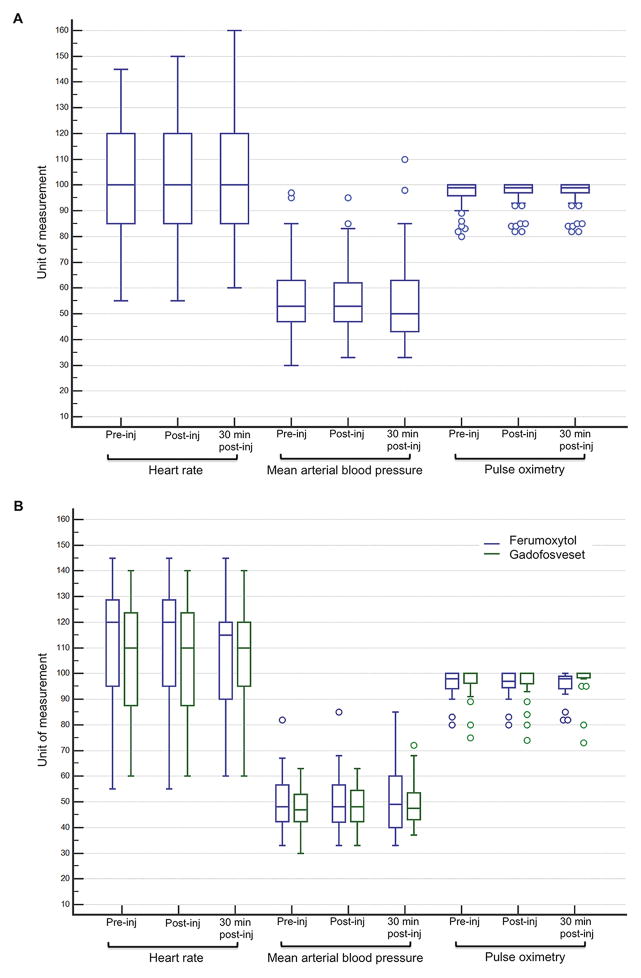
Figure 3.
Distribution of physiologic indices in patients who had ferumoxytol-enhanced MRI exams and gadofosveset-enhanced MRI exams. Data reflect values immediately pre-injection (pre-inj), immediately post-injection (post-inj), and 30-minute post-injection of ferumoxytol or gadofosveset. Whiskers represent data within the lower and upper 1.5 IQR (interquartile range). The bottom and top of the box represent the first and third quartile while the band within the box represents the median. Panel A summarizes the HR (bpm), MAP (mmHg), and pulse oximetry (%) distribution of all patients (n=94, ages 3 days to 86 years, 36% female) undergoing FE-MRI. Variations in HR (p=0.12, 95% CI 93–106 bpm), MAP (p=0.92, 95% CI 49–57 mmHg), and pulse oximetry (p=0.68, 95% CI 95–98%) were not statistically significant. Panel B compares the HR, MAP, and pulse oximetry distribution between a comparable group of patients undergoing FE-MRI (n=23, ages 3 days to 13 years, 43% female) and GE-MRI (n=23, ages 2 days to 12.6 years, 43% female) under general anesthesia. Between group variations were not statistically significant (HR [p=0.69, 95% CI 96–113 bpm], MAP [p=0.74, 95% CI 44–52 mmHg], pulse oximetry [p=0.76, 95% CI 94–98%]). All patients were examined under general anesthesia. bpm, beats per minute; HR, heart rate; MAP, mean arterial blood pressure.

