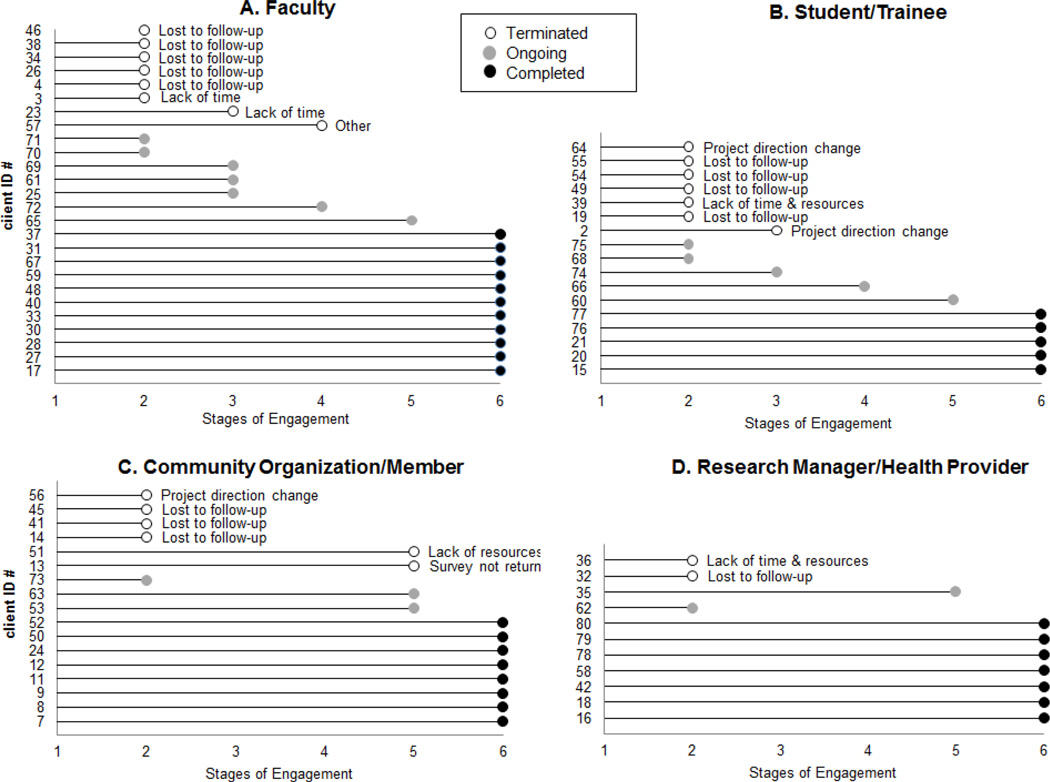
Figure 3. Tracking the status of consult projects by completed, ongoing and incomplete/terminated projects promotes addressing roadblocks to completion.
Each line represents a single client (n=71) and the length of the line represents the progress through the 6 stages of engagement (along x axis). Within each category of client (A. Faculty, B. Student/Trainee, C. Community Organization/Member, D. Research Managers/Health Providers) completed client projects are shown by black dots, ongoing projects by gray dots and open dots represent projects that terminated before completion. Each incomplete/terminated project is labeled with a reason for non-completion.

