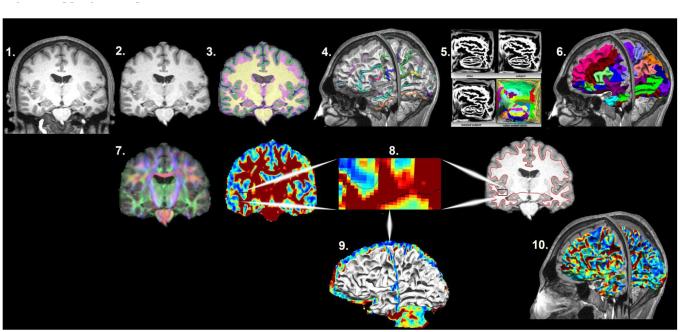
Fig. 1. Mapping the Superficial White Matter.
Legend. Processing Steps in order to map the superficial white matter. 1. Original T1 structural image. 2. Bias field correction and skull stripping. 3. Tissue classification. 4. Surface extraction and sulcal line drawing. 5. Spatial alignment to the atlas. 6. Region of Interest surface labeling. 7. Distortion correction and co-registration of the diffusion image to the structural MRI image. 8. FA and T1 images with zoom to show the surface boundary. 9. Superficial white matter spatially aligned surface and the FA image allows sampling of diffusivity values at each vertex of the surface. 10. Superficial white matter spatially aligned surface with FA estimated at each vertex. FA = Fractional Anisotropy.

