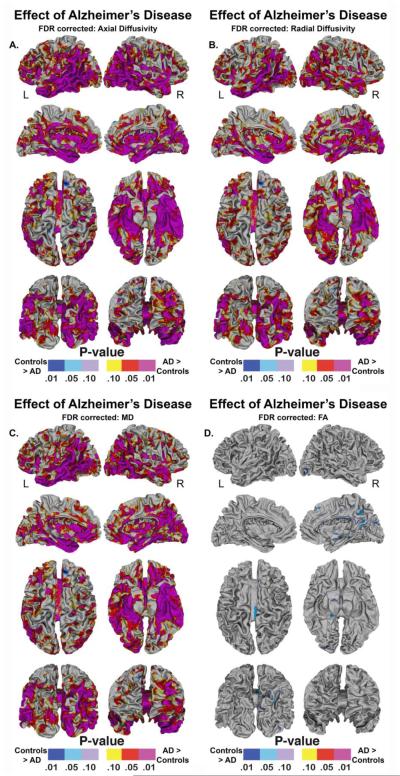
Fig. 4. Vertex Based Superficial White Matter Findings.
Legend. Probability maps showing effects of Alzheimer’s disease on the superficial white matter (A) Axial Diffusivity, (B) Radial Diffusivity, (C), Mean Diffusivity, (D), Fractional Anisotropy, controlling for age and gender mapped at high-spatial resolution at thousands of homologous locations within the superficial white matter. The direction of effects are indicated by the color bar. For (A-C), red indicates increased diffusivity with disease and blue indicates reduced diffusivity with disease. For (D), blue indicates lower fractional anisotropy with disease and red indicated higher fractional anisotropy with disease.

