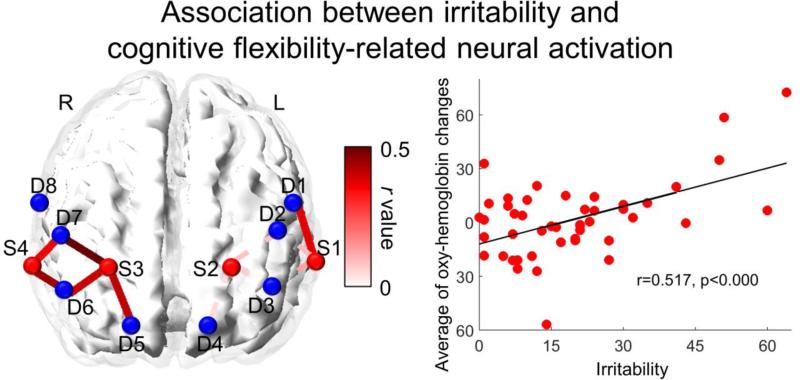
Figure 4.
Channel space map showing associations between irritability and oxygenated-hemoglobin differences between Stroop and Non-Stroop conditions, controlling for age. Solid color lines represent significant correlations and dashed lines represent insignificant correlations between each source-detector pair and irritability. The color bar represents the intensity of the correlation coefficient, with a range of 0 to 0.5. Scatter plot showing the association between irritability and oxy-hemoglobin changes averaged across significant channels in the right DLPFC.

