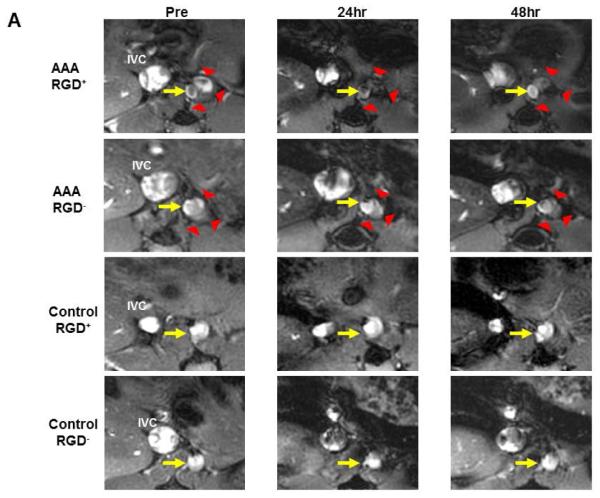
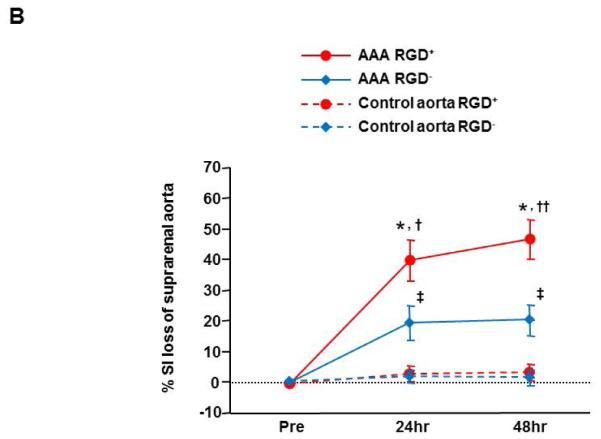
Figure 2. Serial in vivo MRI of abdominal aortic aneurysms (AAA) and control aortae with RGD-HFn-Fe3O4 or HFn-Fe3O4.
(A) The aneurysmal site (red arrowheads) and aortic lumen (yellow arrows) in the suprarenal aorta are clearly seen prior to RGD-HFn-Fe3O4 or HFn-Fe3O4 injection (AAA-Pre). After the injection, T2* signal loss of the AAA was seen at 24 and 48 hours in RGD+ mice, with more limited signal loss in RGD− mice. In the saline control mice, signal loss in the suprarenal aorta was not seen in either group. (B) By quantitative analysis, the AAA showed significant % reduction in the normalized signal intensity (% SI loss) at 24 and 48 hours in both RGD+ and RGD− groups, but the % SI loss of RGD+ group was significantly greater. The suprarenal aorta of saline control mice showed minimal % SI loss in both groups.
* p<0.01 vs. Pre, p<0.01 vs. control aorta, † p=0.04 vs. RGD− group, †† p=0.01 vs. RGD− group, ‡ p<0.05 vs. Pre, p<0.05 vs. control aorta


