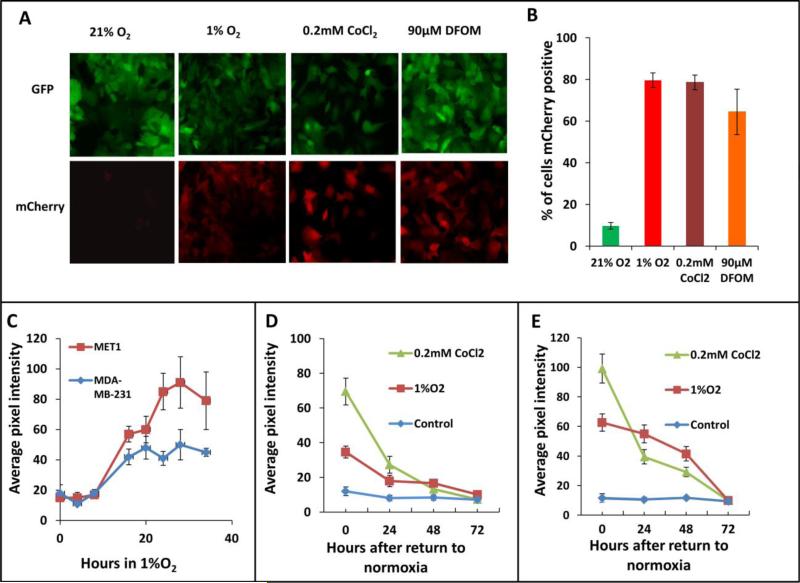
Figure 2. Hypoxia reporter characterization in vitro.
A) Representative images of GFP MET1-5HRE-ODD-mCherry cells in vitro in normoxia and hypoxia induced by 1% O2, 0.2 mM CoCl2 and 90μM DFOM for 20 hours respectively. B) Quantification of percent of cells expressing mCherry in normoxia, or after 20 hours of hypoxia induction with 1% O2, 5% CO2 and 94% N2 in a gas chamber or with 0.2mM CoCl2 or with 90μM DFOM. Error bars: mean ± s.e.m. C) mCherry expression kinetics of MET1 and MDAMB-231 hypoxia reporter cells upon 1% O2 induction. Error bars: mean ± s.e.m. D) mCherry expression in MET1 and E) MDA-MB-231 hypoxia reporter cells. Images analyzed were taken at the times shown after the cells were returned to normoxia after hypoxia treatment of 1%O2 or 0.2mM CoCl2. error bars: mean ± s.e.m.

