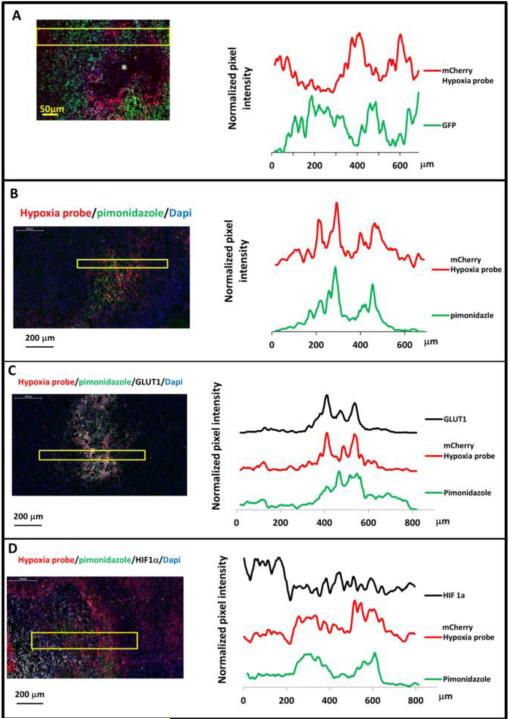
Figure 3. Hypoxia reporter signal co-localizes with hypoxia response markers in mammary tumors.
A) Representative image of GFP MDA-MB-231-5HREODD-mCherry derived tumor frozen tumor sections within normoxic and hypoxic regions relative to the necrotic area (*) (left panel) and the quantification of normalized GFP or mCherry signal in the yellow box (right panel). Green=GFP, normoxia, red=mCherry, hypoxia. B) Representative image showing mCherry overexpressing cells colocalizing with pimonidazole adduct staining in MDA-MB-231-5HREODD-mCherry derived tumor frozen sections (left panel), and the quantification of average pimonidazole or mCherry signal in the yellow box. Green=pimonidazole, red=mCherry, blue=nuclei. C) Representative image showing mCherry overexpressing cells correlated with GLUT1 antibody or pimonidazole adduct antibody staining in MDA-MB-231-5HREODD-mCherry derived tumor frozen sections (left panel), and the quantification of average mCherry or GLUT1 or pimonidazole signal in the yellow box (right panel). Green=pimonidazole, red=mCherry, grey=GLUT1, blue=nuclei. D) Representative image showing mCherry overexpressing hypoxic cells or pimonidazole adduct positive cells adjacent to high HIF1α expressing cells in MDA-MB-231-5HREODD-mCherry derived tumor frozen sections (left panel), and the quantification of average mCherry or pimonidazole or HIF1α signal in the yellow box (right panel). Green=pimonidazole, red=mCherry, grey= HIF1α, blue=nuclei.

