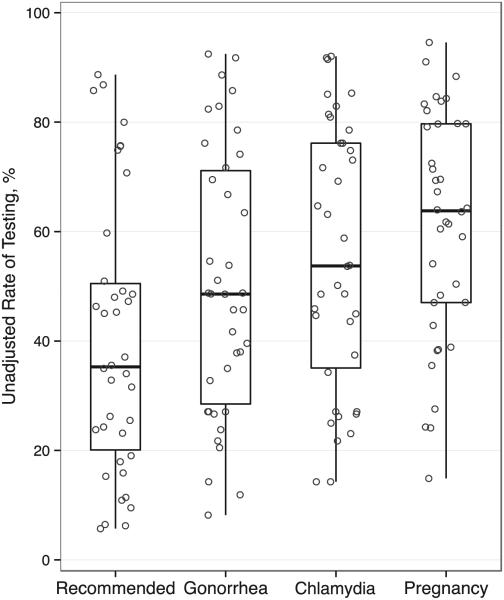
FIGURE 2.
Variation in percentage of adolescents receiving testing across hospitals. Circles represent the rate of testing at each hospital. Box plots summarize the distribution across hospitals: median, inter-quartile range (25th and 75th percentiles), and range (minimum and maximum). Recommended testing included testing for gonorrhea and chlamydia in all patients and testing for pregnancy in female patients.

