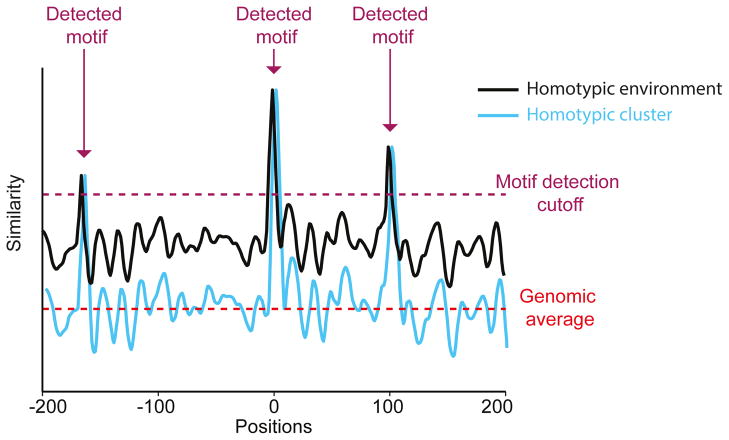
Figure 4.
A simplified scheme demonstrating the conceptual differences between a sequence possessing homotypic clusters (cyan) and a sequence characterized by a homotypic environment (black). Plot representing motif similarity (i.e., similarity between the position weight matrix (PWM) of a TF and a PWM-length window, where high values represent high similarity to the motif) in each position of two hypothetical sequences. In this example, both sequences possess three detectible motifs (i.e., positions with similarity scores higher than the required detection cutoff, marked by purple arrows). However, while the sequence in cyan (representing homotypic clusters) shows an overall low similarity to the motif, equivalent to the average similarity score found in the genome (marked by pink dashed line), the sequence in black (representing a homotypic environment) possesses high similarity scores across the entire sequence (higher than the genomic average).

