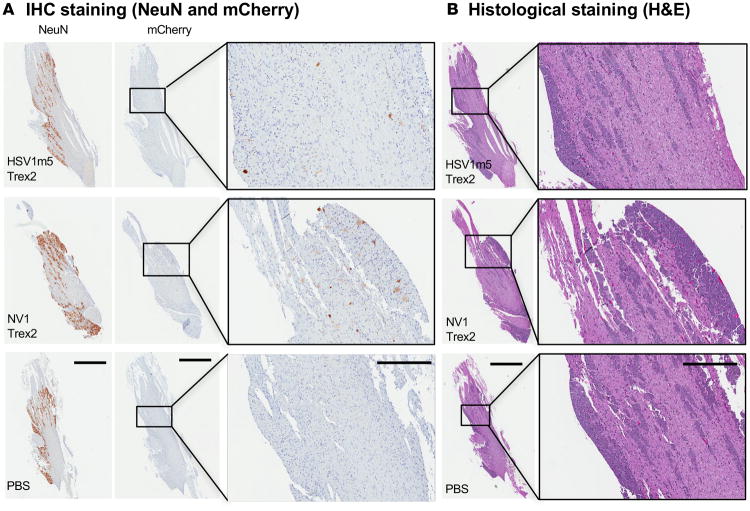
Figure 4. IHC and histological staining of TG from mice exposed to HSV-specific HE.
(A) IHC staining for NeuN and mCherry. Left and middle panels scale bar: 1 mm; right panels scale bar: 300 μM. (B) H&E staining of TGs from naive control mice injected with either 1 × 10¹² ssAAV1-smCBA-NV1-Trex2-mCherry, ssAAV1-smCBA-NV1-Trex2-mCherry, or 50 μl PBS. Left panels scale bar: 1 mm; right panels scale bar: 300 μM

