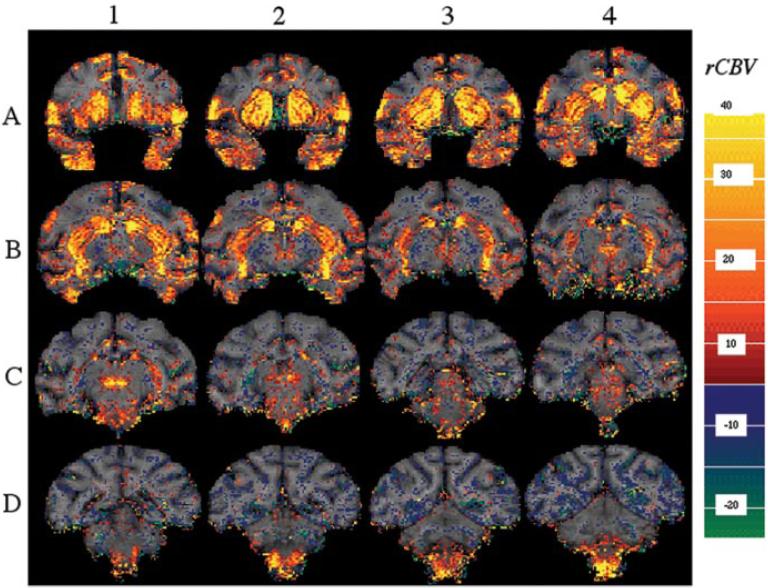
Figure 1.
Parametric map of rCBV change induced by 2.5mg of amphetamine in a control macaque. Serial coronal slices (2mm thick from anterior to posterior) demonstrate prominent responses in many dopaminoceptive regions. Large rCBV increases are seen in the putamen and caudate (including the tail of the caudate seen in B1, B2), the parafascicular thalamus (C1), the anterior cingulate (A1-A4), the precentral gyrus (A1-A4), and the brainstem nuclei, including the substantia nigra, the ventral tegmental area, and red nuclei (B3, B4, C1, C2, D1, D2). Smaller decreases in rCBV were noted in the posterior parietal cortex and occipital cortex (D1-D4). The color bar represents the average rCBV change between 0 and 30 min after amphetamine. Red-yellow represent increases in rCBV, whereas blue- green represent decreased rCBV.

