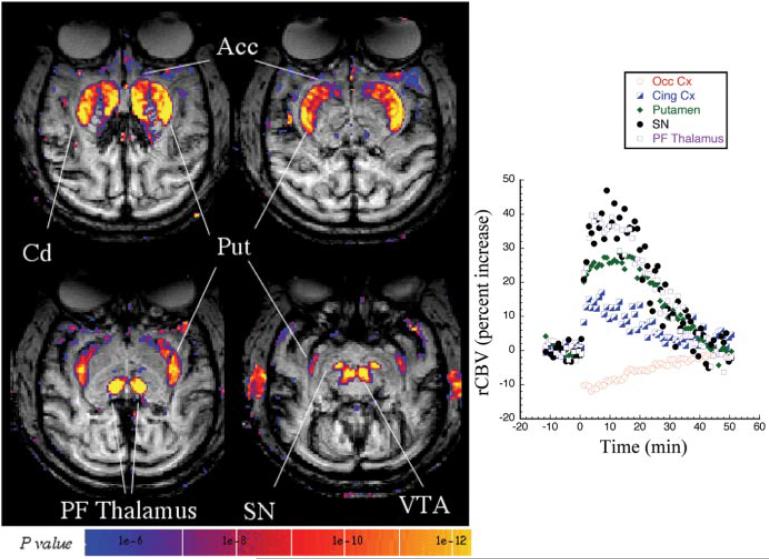
Figure 2.
A statistical parametric map (t test; left) of significant rCBV increases in a control macaque (2.5 mg/kg amphetamine) acquired in the transaxial plane. Large increases in rCBV are seen in the same regions as the coronal orientation shown in Figure 1 but are much better delineated in the brainstem nuclei [substantia nigra (SN), ventral tegmental area (VTA)] in this orientation. Shown on the right is the time course of rCBV changes after amphetamine at time 0 in selected brain regions, including occipital cortex (Occ Cx), anterior cingulate cortex (Cing Cx), putamen (Put), SN, and parafascicular thalamus (PF Thalamus). The amphetamine-induced changes returned to baseline in ~50 min. For the sake of clarity, only positive rCBV changes are shown in this image.

