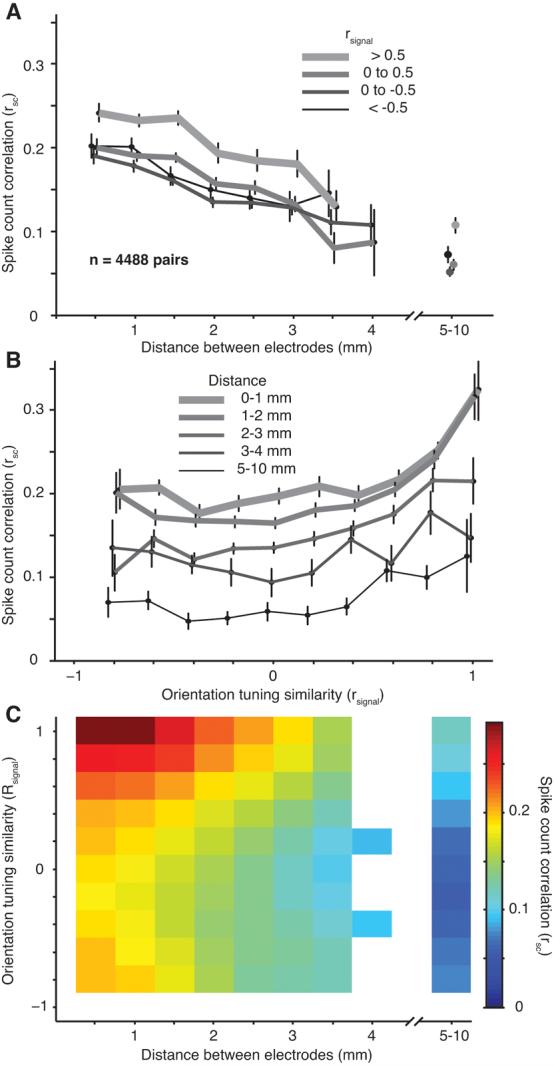
Figure 3.

Dependence of rsc on distance and tuning similarity. A, The dependence of rsc on distance for pairs grouped based on their orientation tuning similarity (rsignal, thicker lines are for pairs with the most similar orientation tuning). The distance bins start at 0.25 mm and extend to 4.25 mm in 0.5 mm increments. The average of all the data is plotted at the center value of each bin. Data from dual-recording experiments (567 pairs) are shown with separate symbols to the right of the axis. Error bars on this and all subsequent plots indicate ± 1 SEM; the points are shifted slightly from their true value along the abscissa for illustration purposes only. In this and all subsequent plots, only data points corresponding to 5 or more neuronal pairs are shown. B, The dependence of rsc on rsignal for pairs grouped by their separation, thinner and darker lines are for more distant pairs. The rsignal bins start at −1.1 and extend to 1.1 in 0.2 increments. The average of all the data is plotted at the center value of each bin. C, The dependence of rsc on both distance and tuning similarity. The scale of the color plot is indicated by the bar at the right. The original data in this and all subsequent surface plots was smoothed with a 2D Gaussian (SD of 1 bin).
