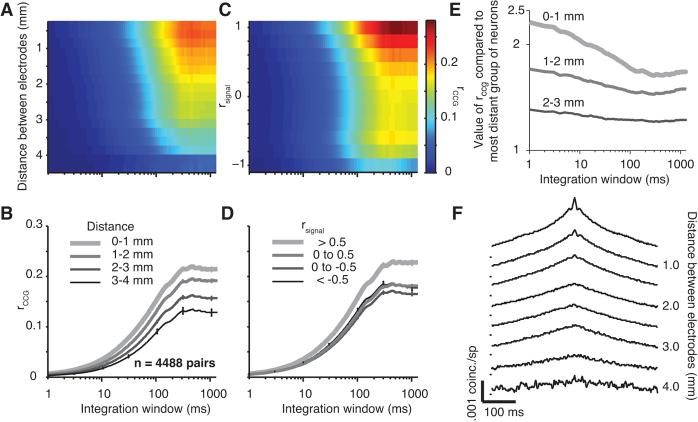
Figure 4.
Effect of distance on the time scale of correlation. A, Surface plot showing the value of rccg for different integration windows and distances between electrodes. The color scale is shown to the left of panel E. B, rccg as a function of integration window for different distance groups (thinner and darker lines for more distant pairs). C, Surface plot showing the value of rccg for different integration windows and tuning similarity. The color scale is shown on the right. D, rccg as a function of integration window for different rsignal groups (thinner and darker lines indicate pairs with less similar tuning preferences). E, For neurons in three distance groups (thinner and darker lines are more distance), the value of rccg is shown as a ratio to its value at the longest distance (3–4 mm). F, Average shuffle-corrected CCGs for pairs of neurons grouped by distance. The tick marks to the left of the CCGs indicate a value of 0 coinc./sp.

