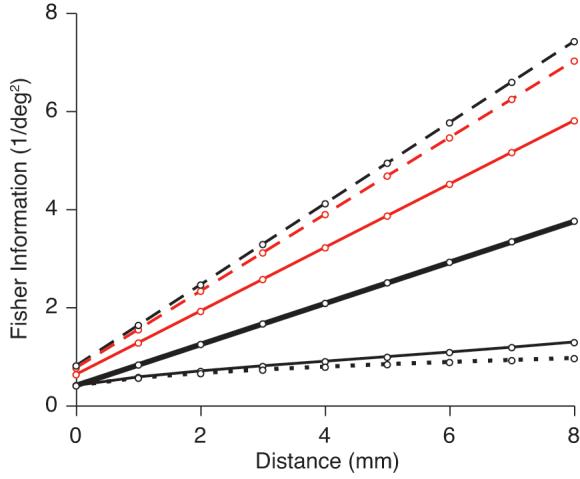
Figure 8.

Impact of correlation structure on the Fisher information. We calculated the Fisher information represented by a population of neurons with various correlation structures: no correlation (red line), fixed correlation (red dashed line), correlation that decays with distance but not rsignal (black dashed line), correlation that decays with rsignal but not distance (black dotted line), and the full correlation structure measured in our experimental data, including both the dependence on distance and tuning similarity (thin black line). If rsc decreased more quickly with distance (at the rate we observed for synchrony), the decrease in the Fisher information would be mitigated (thick black line).
