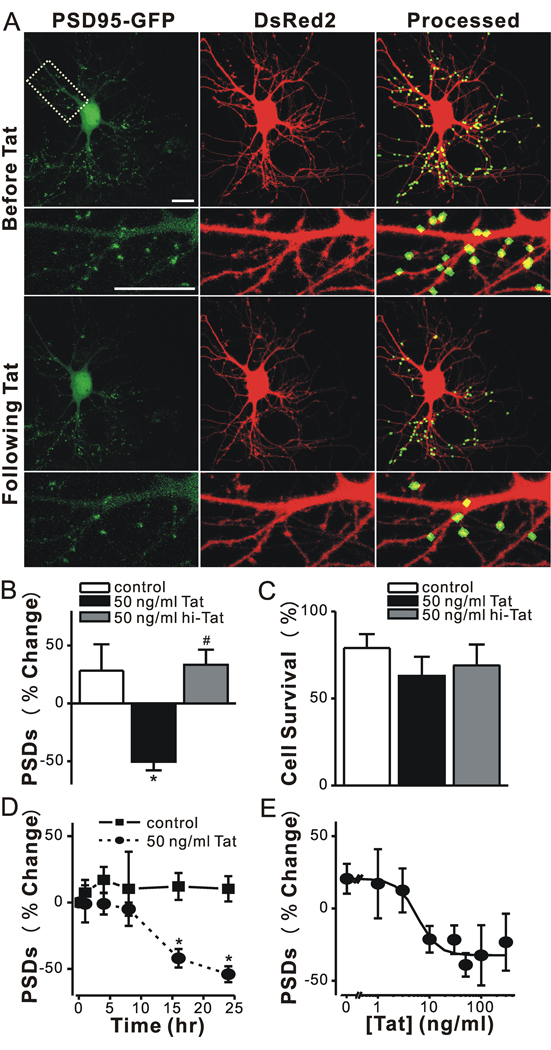
Figure 1. HIV-1 Tat induced PSD loss in a time and concentration dependent manner.
A, Confocal fluorescent images display maximum z-projections of neurons expressing PSD95-GFP and DsRed2 before and 24 hr after treatment with 50 ng/ml Tat. Processing of PSD95-GFP images identified PSDs as fluorescent puncta meeting intensity and size criteria and in contact with a mask derived from the DsRed2 image. Labeled PSDs were dilated and overlaid on the DsRed2 image for visualization purposes (processed). The insets are enlarged images of the boxed region. Scale bar represents 10 µm. B–C, Bar graphs summarize the effects of Tat on changes in PSD95-GFP puncta (B, PSDs) and cell viability (C, Cell survival) after 24 h treatment under control conditions (control, open bars) or following treatment with 50 ng/ml Tat (solid bars) or 50 ng/ml heat inactivated Tat (hi-Tat, gray bars). Data are mean ± SEM. *p<0.01 relative to control; #, p<0.01 relative to Tat (ANOVA with Bonferroni post-test). D, Graph shows time-dependent changes in the number of PSD95-GFP puncta for untreated cells (control, squares) and cells treated with 50 ng/ml Tat (circles). Data are expressed as mean ± SEM. *, p<0.01 relative to PSDs counted prior to the addition of Tat (0 hr). ANOVA with Bonferroni post test. E, Graph shows concentration-dependent changes in the number PSD95-GFP puncta for cells treated with the indicated concentration of Tat. The mean ± SEM of the net change in PSD95-GFP puncta 24 hrs after treatment with Tat are plotted for the concentrations indicated (n ≥ 4 for each data point). The curve was fit by a logistic equation of the form % PSD change = [(A1 – A2)/(1 + (X/EC50)p)]+A2 where X = Tat concentration, A1 = 21 ± 7 % PSD change without Tat, A2 = −32 ± 5 % PSD change at a maximally effective Tat concentration and p = slope factor. EC50 was calculated using a nonlinear, least-squares curve fitting program. EC50 and p were 6 ± 2 ng/ml and 2 ± 1, respectively.

