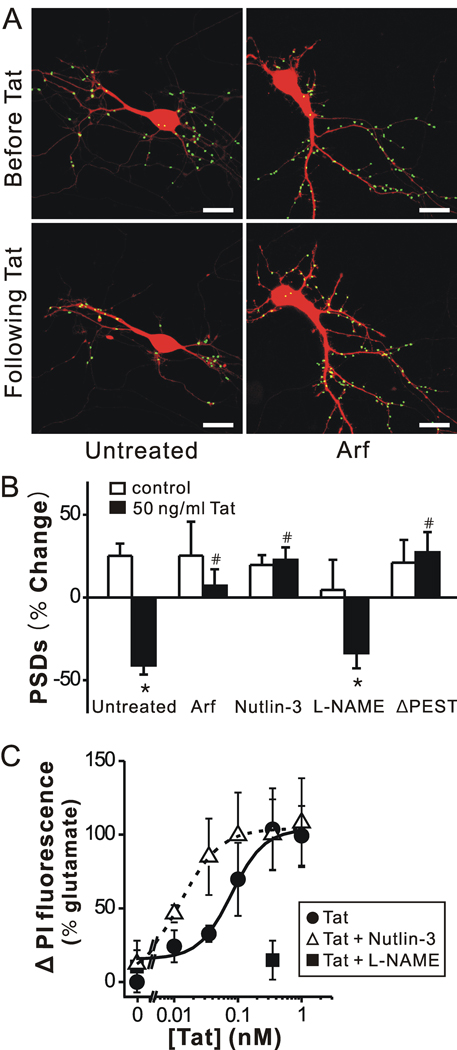
Figure 3. Tat induced PSD loss via the ubiquitin-proteasome pathway and Tat induced cell death by activating NOS.
A, Processed images acquired before and after 24 h treatment with 50 ng/ml Tat in cells co-expressing ARF display labeled PSDs superimposed on DsRed2 fluorescence. Scale bar represents 10 µm. B, Bar graph summarizes the effects of inhibition of the ubiquitin-proteasome pathway and inhibition of nNOS on changes in PSD-GFP puncta (PSDs) after 24 h treatment under control (open bars) or 50 ng/ml Tat-treated (solid bars) conditions. Cells were treated with ARF (expression plasmid co-transfected with DsRed2 and PSD95-GFP), 1 µM nutlin-3 or 100 µM L-NAME as indicated. In cells expressing PSD95ΔPEST-GFP (ΔPEST), Tat did not affect the number of synaptic sites. Data are expressed as mean ± SEM. *, p<0.01 relative to control; #, p<0.01 relative to Tat alone (untreated) (ANOVA with Bonferroni post-test). C, Inhibition of an ubiquitin ligase increased and inhibition of NOS decreased, Tat-induced cell death. Cell death was measured using the PI fluorescence assay detailed in Materials and Methods. Cell death was measured after 48 h treatment with the indicated concentrations of Tat in the absence (control, circles) or presence of 1 µM nutlin-3 (open triangles) or 100 µM L-NAME (squares). PI fluorescence was normalized to that measured from cells treated for 48 h with 1 mM glutamate (100 %). PI fluorescence from untreated wells was subtracted from each curve (0 %). Concentration response curves were generated by fitting a logistic equation to the data using a nonlinear, least-squares curve fitting program (Origin 6.0) and EC50 values calculated. A logistic equation of the form Δ PI Fluorescence = [(A2 – A1)/(1 + (X/EC50)p)]+A1 where X = Tat concentration, A1 = % change in PI fluorescence without Tat, A2 = % change in PI fluorescence at maximal Tat concentration and p = slope factor. A set of triplicate wells from a single plating of cells was defined as a single experiment (n = 1). All data are presented as mean ± SEM.

