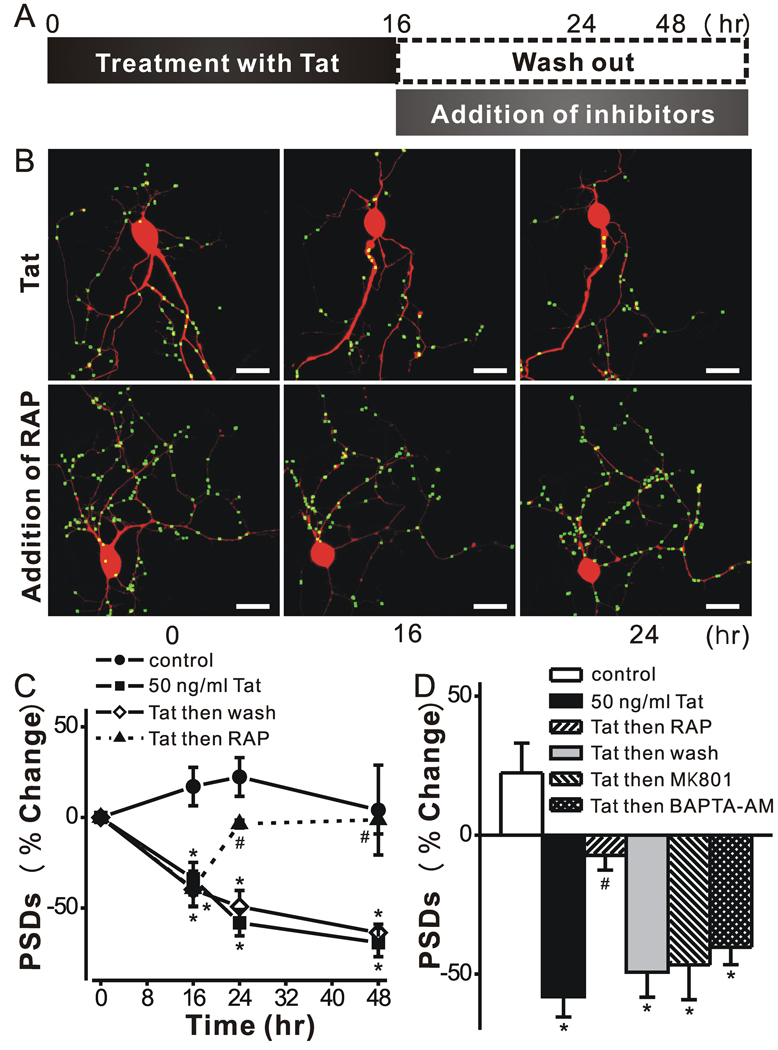
Figure 4. Tat-induced PSD loss is reversible.
A, schematic shows time line for experiments. B, Representative images display labeled PSDs on neurons expressing PSD95-GFP and DsRed2 before (0 h) and during (16 & 24 h) treatment with 50 ng/ml Tat. The LRP inhibitor RAP (50 nM) was added after 16 h (lower frames). Note that PSDs lost after 16 h exposure to Tat recovered following treatment with RAP. C, Graph shows significant PSD loss after 16 h exposure to Tat which was sustained for 48 h in the continued presence of tat (squares) or if Tat was removed after 16 h (open diamonds). PSDs recovered to control (circles) levels following addition of RAP at 16 hrs (triangles). Data are expressed as mean ± SEM. *, p<0.01 relative to control; #, p<0.001 relative to Tat alone for 16 hr (ANOVA with Bonferroni post-test). D, Bar graph summarizes the net changes in the number of PSD95-GFP puncta (PSDs) 24 h after no treatment (control, open bar) or the addition of Tat (solid bars). The indicated treatments were applied after 16 h exposure to Tat and changes were measure 8 hrs later (24 h elapsed time). Data are expressed as mean ± SEM. *, p<0.01 relative to control; #, p<0.05 relative to Tat alone for 24 hr (ANOVA with Bonferroni post-test).

