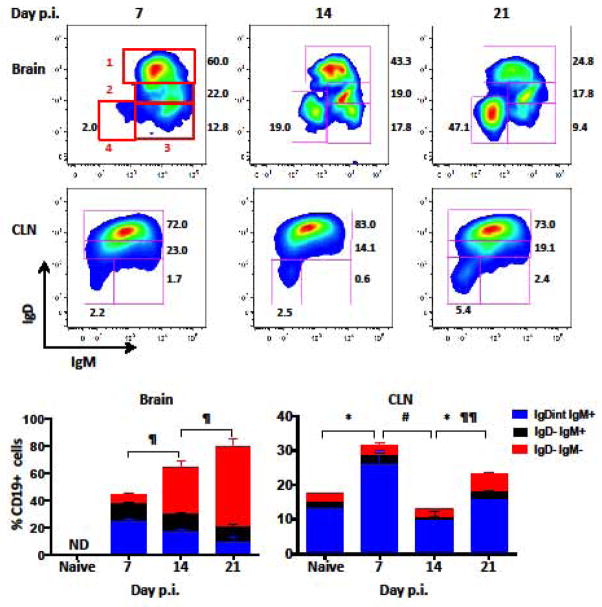
Figure 1. Dynamics of B cell subsets within the CNS and CLN during JHMV infection.
Brain and CLN derived cells isolated from pooled organs of naïve or infected mice at day 7, 14, and 21 p.i. were analyzed for their IgD, IgM, and isotype-switched phenotype by flow cytometry. Representative density plots depict gating strategy for IgD+IgM+ naïve B cells (1), IgDintIgM+ early activated (2), IgD−IgM+ activated (3), and IgD−IgM− isotype-switched (4) within CD45hiCD19+ cells from brain and CLN as indicated. Red numbers indicate respective gates and black numbers show percent of populations. Stacked bar graphs show percentages of IgDintIgM+, IgD−IgM+, and IgD−IgM− cells within CD45hiCD19+ cells and their changing dynamics over time. IgD+IgM+ naïve B cells make up the remaining percentage of cells. B cells within brains of naïve mice were not detectable (ND). Data are expressed as the mean percentage ± SEM from 3–4 independent experiments each comprising 3–6 pooled brain or CLN per time point. Significant differences demarcated by * for IgDint IgM+, # for IgD− IgM+, and ¶ for IgD−IgM− B cell populations with * # ¶ denoting (p < 0.05) and ¶¶ denoting (p < 0.01).

