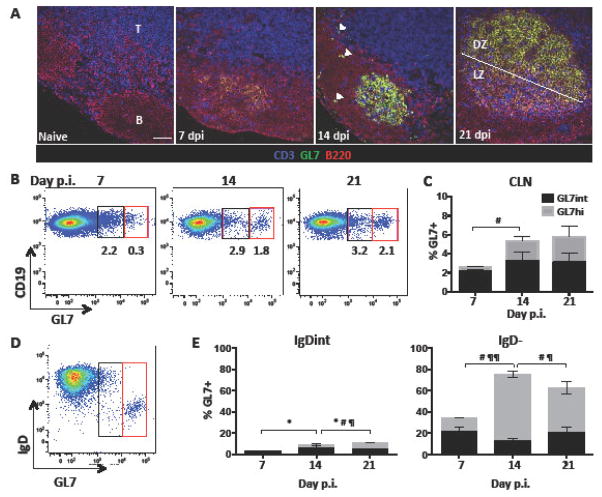
Figure 3. GC formation is robust within the draining CLN by day 21 p.i.
(A) GC formation within CLN of naïve and infected mice at days 7, 14, and 21 p.i. was assessed by immunohistochemistry using anti-B220 (red), GL7 (green) to mark GC B cells, and CD3 (blue) mAb. B cell follicles and T cell zones are indicated by (B) and (T) respectively. GL7+ B cells form prominent structures by day 14 p.i.; white arrows indicate occasional GL7+ cells dispersed in follicular areas and the B-T cell border. Light (LZ) and dark zones (DZ) are established at day 21 p.i. Representative images from 2 independent experiments with 3–4 mice per experiment. Scale bar=50μm. (B) Representative flow cytometry plots showing GL7 expression by CLN derived CD19+ B cells at day 7, 14, and 21 p.i. GL7+ cells segregate into GL7int (black) activated pre-GC cells and GL7hi (red) B cells typical of GC B cells. (C) Percentages of GL7int (black) and GL7hi (gray) cell within total CD19+ B cells in CLN at day 7,14, and 21 p.i. (D) Representative density plot gated on CLN CD19+ B cells at day 14 p.i. demarcating IgD expression among GL7int and GL7hi populations. (E) Relative percentages of GL7int and GL7hi cells within IgD+, IgDint, or IgD− CLN derived CD19+ B cells at day 7, 14, and 21 p.i. Data in (B) and (D) are expressed as the mean percentage ± SEM and represent 3–4 independent experiments each comprising pooled CLN from 3–6 mice per time point. Significant differences between time points are indicated by * (p≤0.05) for GL7int, # (p≤0.05) for GL7hi, and ¶ (p≤0.05) or ¶¶ (p≤0.01) for total GL7+ cells.

