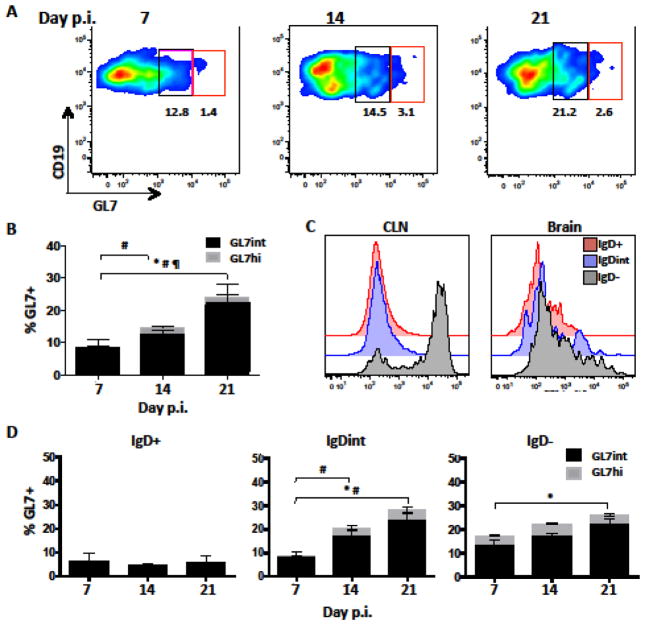
Figure 6. GL7+ B cells accumulate within the CNS during JHMV infection.
Analysis of GL7 expression in brain derived B cells at day 7, 14, and 21 p.i. by flow cytometry. (A) Representative density plots showing gating strategy of GL7int (black) and GL7hi (red) within total CD19+ cells. Numbers in plots indicate relative percentages of GL7int and GL7hi populations. (B) Stacked bar graph shows increasing percentages of GL7int and GL7hi B cells during viral persistence. (C) Representative histogram comparing GL7 expression intensity on IgD+ (red), IgDint (blue), and IgD− (gray) B cell subsets within CLN and Brain at day 14 p.i. (D) Relative percentages of GL7int and GL7hi cells within IgD+, IgDint, or IgD− brain derived CD19+ B cells at day 7, 14, and 21 p.i. Data in (B) and (D) are expressed as the mean percentage ± SEM and represent 3–4 independent experiments each comprising 3–6 pooled brains per time point. Significant differences between time points are indicated by * (p≤0.05) for GL7int, # (p≤0.05) for GL7hi, and ¶ (p≤0.05) for total GL7+ cells.

