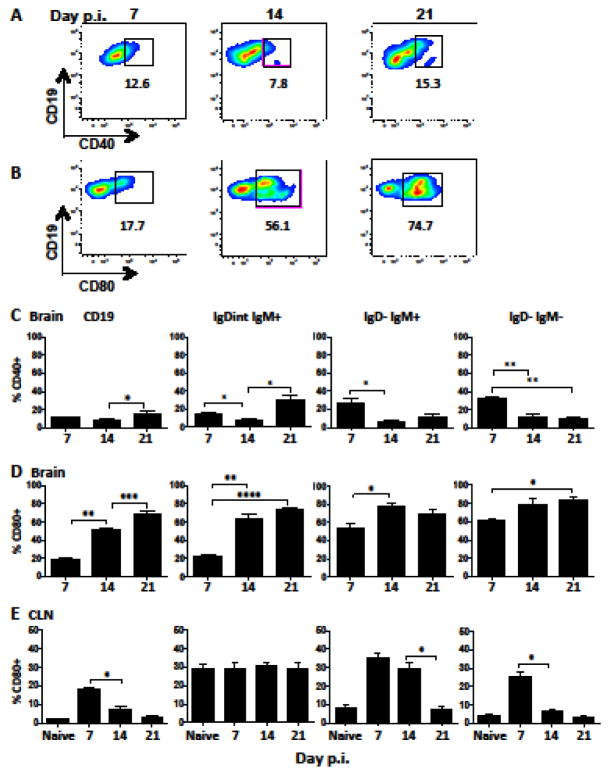
Figure 7. Activated and differentiated B cells express markers of CD4 T cell help within the brain.
Representative density plots and gating of CD40 (A) and CD80 (B) expression on brain derived CD45hiCD19+ B cells at day 7, 14, and 21 p.i. Percentages of CD40+ cells (C) or CD80+ cells (D,E) within total CD19+ or the indicated B cell subsets derived from brain (C,D) or CLN (E) determined by flow cytometry. Data are expressed as the mean percentage ± SEM and represent 3–4 independent experiments each comprising 3–6 pooled brain or CLN per time point. Statistically significant differences between time points are indicated by * p≤0.05, ** p≤0.01, *** p≤0.001 and **** p≤0.0001.

