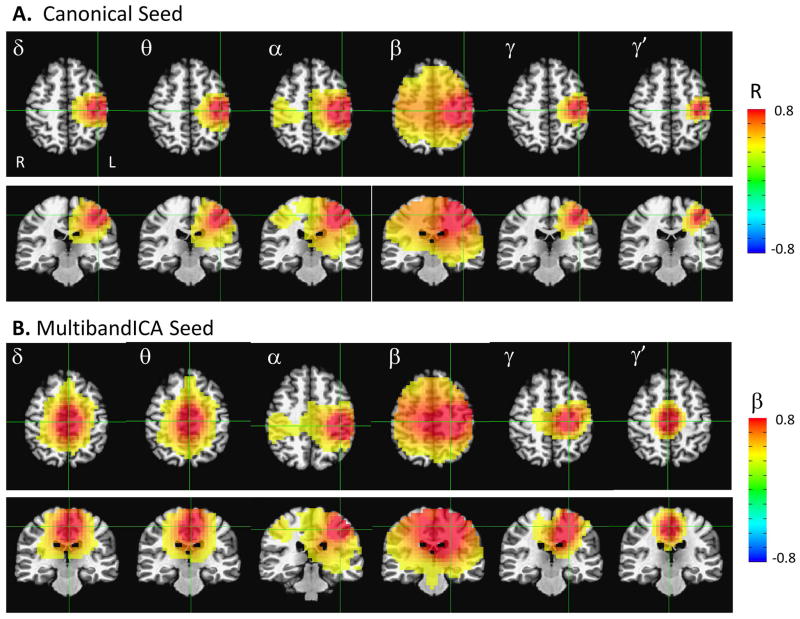
Figure 4.
Seed-based correlation maps across temporally concatenated Hilbert envelope time series data. A) Correlation maps using the canonical left motor cortex seed. B) Correlation maps using the peak voxel for each frequency band resulting from the Multiband independent components analysis (ICA). All maps are thresholded at a regression weight greater than 0.3 or −0.3. Images are presented in radiological orientation.

