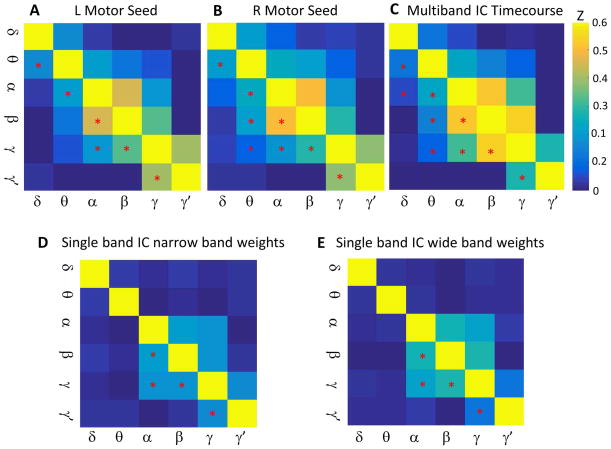
Figure 6.
Cross-frequency amplitude-amplitude coupling matrices. A) A matrix showing the mean Z-transformed correlation across subjects of the left motor seed time course at each frequency with every other frequency. Mean correlations significant by one-sample t-test at p<0.0033 are denoted by asterisks in the lower diagonal of the matrix. B) Identical to A), but for the right motor cortex. C) Z-transformed correlation matrix between the Multiband independent components analysis (ICA) time courses for each frequency with all other frequencies. D) and E) Z-transformed correlation matrix between the single-band ICA time courses for source projections derived from narrow-band and wide-band beamformer weights, respectively. Single-band ICA components were chosen based on temporal correlation with motor network Multiband ICA time courses. Spatial maps of the chosen single-band ICs are shown in Supplemental Figure 6. In all panels, significant correlations are denoted by asterisks in the lower diagonal of the matrix.

